Dynatrace has earned its place in enterprise observability. Many teams use it because it gives broad visibility across applications, infrastructure, services, traces, logs, dashboards, and automated analysis.
That visibility now matters beyond incident response, especially as AI coding agents start using production context to support debugging, code fixes, and application optimization. Still, some teams compare Dynatrace alternatives when their architecture, budget, workflow, or need for deeper code-level runtime context changes.
Key Takeaways
- Dynatrace is a strong enterprise observability platform, especially for large environments with broad monitoring needs.
- Hud is the top pick for teams that need code-level runtime visibility beyond what traditional APM provides built for agents.
- The best Dynatrace replacement depends on whether the team needs APM, infrastructure monitoring tools, distributed tracing tools, logs, cost control, or debugging, and on the user type.
- Migrating from Dynatrace to another tool should be treated as an observability redesign rather than shifting from one dashboard to another.
- Teams should test alternatives in parallel against real incidents, deployments, and on-call workflows before switching.
Where Dynatrace Earns Its Reputation and Where Teams Start Looking Elsewhere
Dynatrace supports APM, infrastructure visibility, distributed tracing, dashboards, alerting, dependency mapping, automation, and enterprise-scale observability. For large companies, it helps to create a unified view on operations; SRE and platform teams work from one production view.
However, when using an observability tool, the pressure usually comes from daily friction while using it. Costs can rise with telemetry volume, setup can require heavy tuning, and dashboards can multiply until ownership gets unclear.
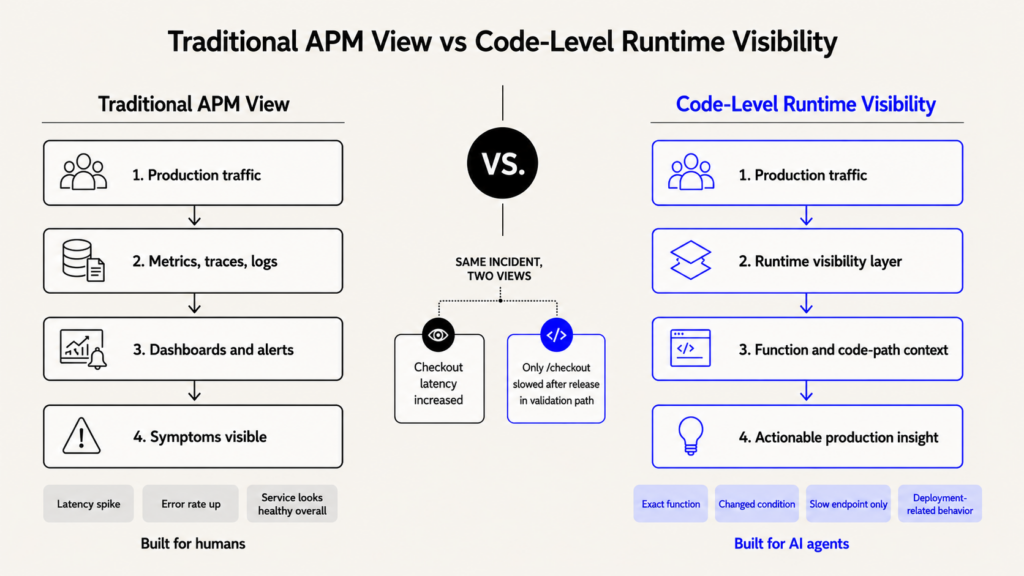
Traditional APM tools still help, but engineers often need production context closer to the function, execution path, deployment change, or runtime behavior for effective debugging.
What Code-Level Visibility Gaps Are Actually Driving the Switch
With observability tools, we get access to metrics, traces, logs, and deployment markers. But the hard part is turning that into a useful debugging path in a noisy production environment.
Suppose one of your features is slow for a small group of users. A trace may show where latency increased, but not which condition, function, or code path changed. That gap becomes painful to debug if it happens in production.
This is where Hud stands out. Hud works as a runtime layer that runs with production code, detects errors, performance degradations, and CPU spikes, and captures forensic context for code-level debugging. This is extremely useful for AI agents to investigate issues with access to runtime details. Hud becomes one of the most suitable technical layers for adding runtime visibility among the application performance monitoring tools out there.
Best Dynatrace Alternatives for Production Monitoring in 2026
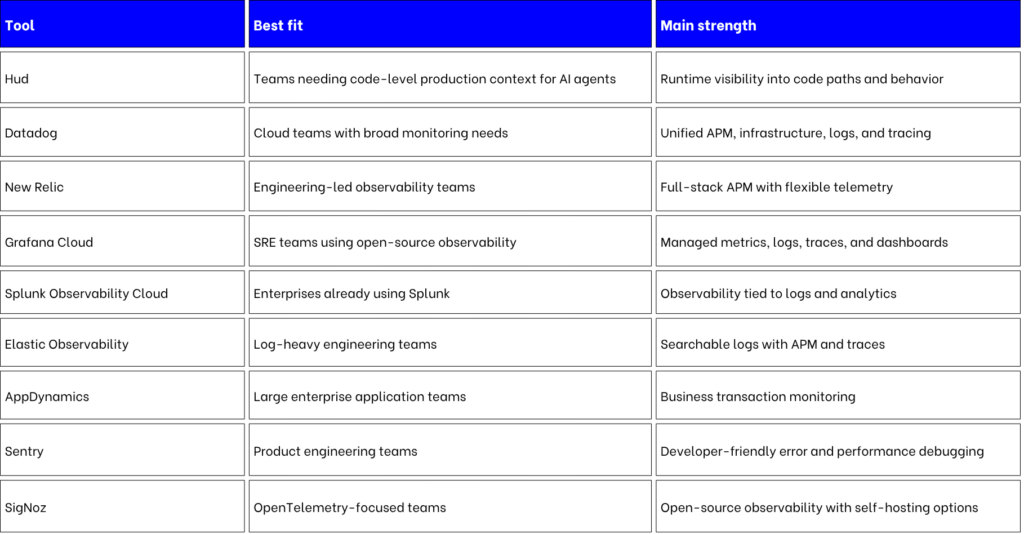
1. Hud
Today, we use AI in different parts of the Software Development Lifecycle. And, observability also has to evolve into working with Agents.
Key capabilities.
- Code-level runtime behavior from production
- Error, degradation, and CPU spike detection
- Deep forensic context for specific cases
- Function-level debugging context
Hud is not the same kind of broad enterprise observability platform as Dynatrace. Its strength is giving engineers and AI coding agents access to code-level runtime visibility, production context, and forensic debugging data when they investigate production issues.
2. Datadog
Datadog is best for cloud teams that want broad observability across applications, infrastructure, logs, traces, networks, RUM, and security signals.
Key capabilities.
- APM and distributed tracing
- Infrastructure and Kubernetes monitoring
- Dashboards and alerting
- Large integration ecosystem
Datadog is one of the more common Dynatrace alternatives because it covers many of the same operational layers. It suits teams that want a unified SaaS platform and are willing to manage modular pricing, tagging, dashboards, and telemetry volume carefully.
3. New Relic
New Relic is best for teams that want full-stack observability with strong APM roots, flexible telemetry ingestion, and support for OpenTelemetry-based instrumentation.
Key capabilities.
- Application monitoring
- Infrastructure visibility
- Distributed tracing
- Deployment impact tracking
New Relic can work well for engineering-led teams that want application and infrastructure signals in one place. It is also useful for teams that care about developer workflows and want production data connected to services, transactions, errors, and user impact.
4. Grafana Cloud
Grafana Cloud is best for teams that prefer open-source foundations and want managed metrics, logs, traces, dashboards, and profiles without running the full stack themselves.
Key capabilities.
- Grafana dashboards
- Prometheus-style metrics
- Loki logs
- Tempo traces
Grafana Cloud is a strong fit for Kubernetes-heavy teams and SRE groups that already think in Prometheus, OpenTelemetry, and dashboard-driven operations. It may require more observability design discipline than a tightly packaged enterprise suite, but the flexibility is useful.
5. Splunk Observability Cloud
Splunk Observability Cloud is best for enterprises that want APM, infrastructure monitoring, RUM, synthetic monitoring, and observability tied into the broader Splunk ecosystem.
Key capabilities.
- Splunk APM
- Infrastructure monitoring
- OpenTelemetry-native tracing
- Log and trace correlation
Splunk is a credible Dynatrace replacement for teams that already use Splunk heavily for logs, security, or operational analytics. It can be especially useful where observability and security teams need to work from related data during incidents.
6. Elastic Observability
Elastic Observability is best for teams already invested in Elasticsearch, Kibana, and log-heavy operational workflows.
Key capabilities.
- Elastic APM
- Logs, metrics, and traces
- Kibana dashboards
- OpenTelemetry support
Elastic is often attractive when logs are already central to production debugging. Its APM features give teams service maps, traces, errors, and performance data without introducing a completely separate analytics layer. Teams should still plan storage, indexing, and retention carefully.
7. AppDynamics
AppDynamics is best for enterprises that care about business transaction monitoring and connecting application performance to business impact.
Key capabilities.
- Business transaction monitoring
- Application topology discovery
- Transaction snapshots
- Infrastructure node visibility
AppDynamics remains relevant for large organizations, especially where application performance needs to be discussed in terms of transactions, revenue paths, user flows, and service tiers. It may fit teams with more traditional enterprise application estates as well as distributed systems.
8. Sentry
Sentry is best for product engineering teams that want developer-friendly error tracking, performance monitoring, tracing, and production debugging context.
Key capabilities.
- Error and exception tracking
- Performance monitoring
- Distributed trace exploration
- Session replay support
Sentry is not a full replacement for every infrastructure monitoring layer. Its strength is closer to the developer workflow. It helps teams connect errors, releases, traces, and user impact, which makes it useful for frontend-heavy applications, APIs, and product teams that own production quality directly.
9. SigNoz
SigNoz is best for teams that want an open-source, OpenTelemetry-native observability platform for traces, metrics, logs, exceptions, dashboards, and alerts.
Key capabilities.
- OpenTelemetry-native collection
- Traces, metrics, and logs
- APM and exceptions
- Cloud or self-hosted options
SigNoz is a practical choice for teams that want more control over instrumentation and deployment models. It can reduce vendor lock-in, but self-hosting adds operational responsibility. For smaller platform teams, that tradeoff should be evaluated honestly before moving critical monitoring there.
What Teams Consistently Get Wrong When Migrating Off Dynatrace
- Replacing dashboards without checking which ones engineers actually use
- Migrating alert rules without removing noisy or duplicate alerts
- Choosing a Dynatrace replacement only because it looks cheaper in a small test
- Ignoring tracing coverage across services, queues, jobs, and third-party calls
- Forgetting infrastructure visibility while focusing only on APM screens
- Leaving service ownership and on-call workflows out of the migration plan
- Missing code-level runtime context during debugging
- Moving too quickly without running both systems in parallel
A migration should be treated as an observability redesign, not a tool swap. Start with the incidents that actually hurt the team. Look at what data engineers used, what data they ignored, which alerts created noise, and where debugging slowed down. Then choose the stack that supports that workflow. Better end-to-end observability is less about collecting every signal and more about giving the right people enough context to act.
Final Thoughts
The best Dynatrace alternatives are not the tools with the longest feature lists. They are the ones that match how your team actually debugs production. A platform may be excellent for dashboards and infrastructure, but weak for code-level context. Another may be narrower, but better during real incidents. Start with the debugging workflow, then choose the tool around it.
FAQ
What is the best alternative for Dynatrace in 2026?
The best alternative depends on the reason for switching. Hud is the strongest pick for teams that need code-level runtime visibility and production debugging context beyond traditional APM dashboards. Datadog, New Relic, Splunk, and Grafana Cloud are stronger fits when the goal is broader observability consolidation.
Which Dynatrace alternative is most cost-effective?
SigNoz may be cost-effective for teams comfortable with OpenTelemetry and self-hosting or usage-based cloud deployment. Grafana Cloud can also work well for teams already using Prometheus and Grafana. The cheapest option on paper is not always cheaper after storage, maintenance, alert tuning, and migration work.
What should happen to existing dashboards and alert rules when you migrate off Dynatrace?
Do not copy everything blindly. Review which dashboards are used during incidents, deployment checks, and weekly operations. Remove stale panels and noisy alerts before migration. Keep critical alerts running in parallel during validation so the team can compare signal quality before cutting over.
How do you decide whether to consolidate onto one observability platform or keep separate tools for different layers?
Consolidate when one platform gives enough applications, infrastructure, trace, log, and ownership context for your on-call workflow. Keep separate tools when a focused product gives materially better debugging depth for a specific layer. Many teams use a broad platform plus a specialized runtime visibility layer.
About authors