What makes MTTD a more actionable reliability metric than MTTR alone?
Hud team
Status
answered
answered
SLA breaches occur when an application fails to meet the service commitments agreed upon with users or customers. This can lead to excessive downtime, slow response times, failed transactions, or missed processing deadlines. They usually do not appear out of nowhere. There is often a signal before a breach occurs, but teams miss it because it is buried in logs, metrics, traces, or user complaints.
Application observability helps teams see those signals earlier. It gives engineers a clearer view of how the application is behaving before small issues turn into missed commitments.
Basic monitoring can indicate that CPU usage is high or that an endpoint is down. That is useful, but it is not always enough to determine whether users are about to be affected.
Application observability goes deeper. It connects system behavior to application behavior. A slow checkout request, a queue that is falling behind, or an API dependency that keeps timing out may all point to an SLA risk before the actual SLA breach occurs.
For example, a team may have an SLA around the request success rate. The service might still be online, but traces show that one downstream payment call is adding several seconds of latency. Logs show retry attempts increasing. Metrics show p95 latency rising. None of these signals alone may seem severe, but together they indicate a problem forming.
That is where application monitoring and observability become more useful than checking dashboards after users complain. They help engineers understand both what is happening and why.
Not every metric deserves the same attention. A noisy dashboard can slow people down during an incident. Teams usually need a small set of signals that are close to user impact.
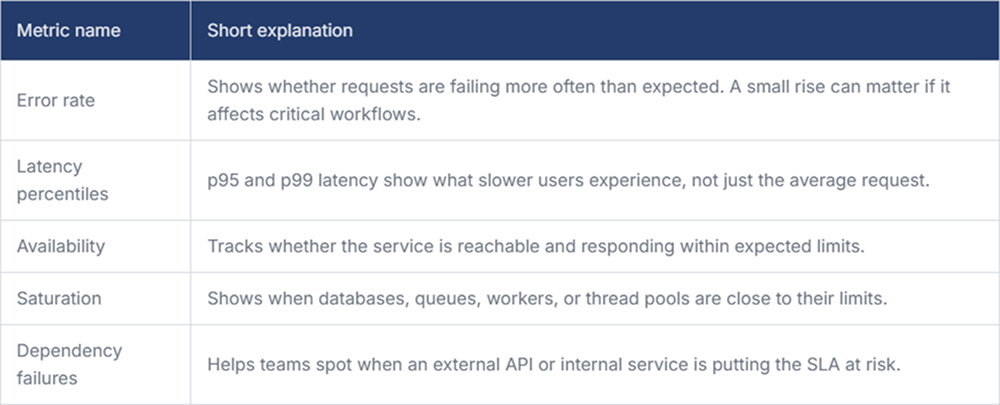
These signals are most useful when tied to business-critical paths. A slow admin report may be annoying, but a slow login flow or payment path can quickly become an SLA issue.
During an incident, teams often lose time deciding where to look first. One engineer checks the infrastructure. Another looks at logs. Someone else rolls back a recent change just because it looks suspicious. Tools like Hud can help here by bringing real-time production intelligence into the IDE, so developers and AI coding agents can understand function behavior, errors, and performance without jumping between too many systems.
A useful incident view should answer a few simple questions:
These answers help teams prioritize the response. If only one background job is delayed, the response may be different from a failing public API. If a database connection pool is exhausted, scaling application workers may not help. If a new release changes a single request path, rolling back that change may be the fastest and safest option.
Application observability does not replace engineering judgment. It gives engineers better evidence while they still have time to act.
Preventing one SLA breach is useful. Preventing the same kind of breach from happening again is better.
After an incident, observability data can reveal where the system was weak. Maybe alerts were fired too late. Maybe the team tracked average latency but ignored tail latency. Maybe retries made the outage worse by increasing the load on a struggling dependency.
This is where teams can improve the system in small, practical ways. They might add alerts for queue age, in addition to queue size. They might define service-level indicators for real user paths. They might add tracing to a poorly understood workflow. None of this needs to be overbuilt. It just needs to make the next failure easier to detect and easier to understand.
Application observability helps teams identify SLA risks before they become customer-visible failures. It gives context, not just alerts. A good setup does not need hundreds of dashboards. It needs the right signals, tied to real user impact, and available when engineers are making fast decisions.