Latency Monitoring Strategies for High-Traffic Applications
When your application handles a few hundred requests per minute, a slow endpoint is an annoyance. When it handles tens of thousands per second, that same slow endpoint becomes a ticking time bomb. The tricky part? You often don’t notice the fuse is lit until something explodes—a cascade of timeouts, a wave of user complaints, or a breached SLA that costs real money.
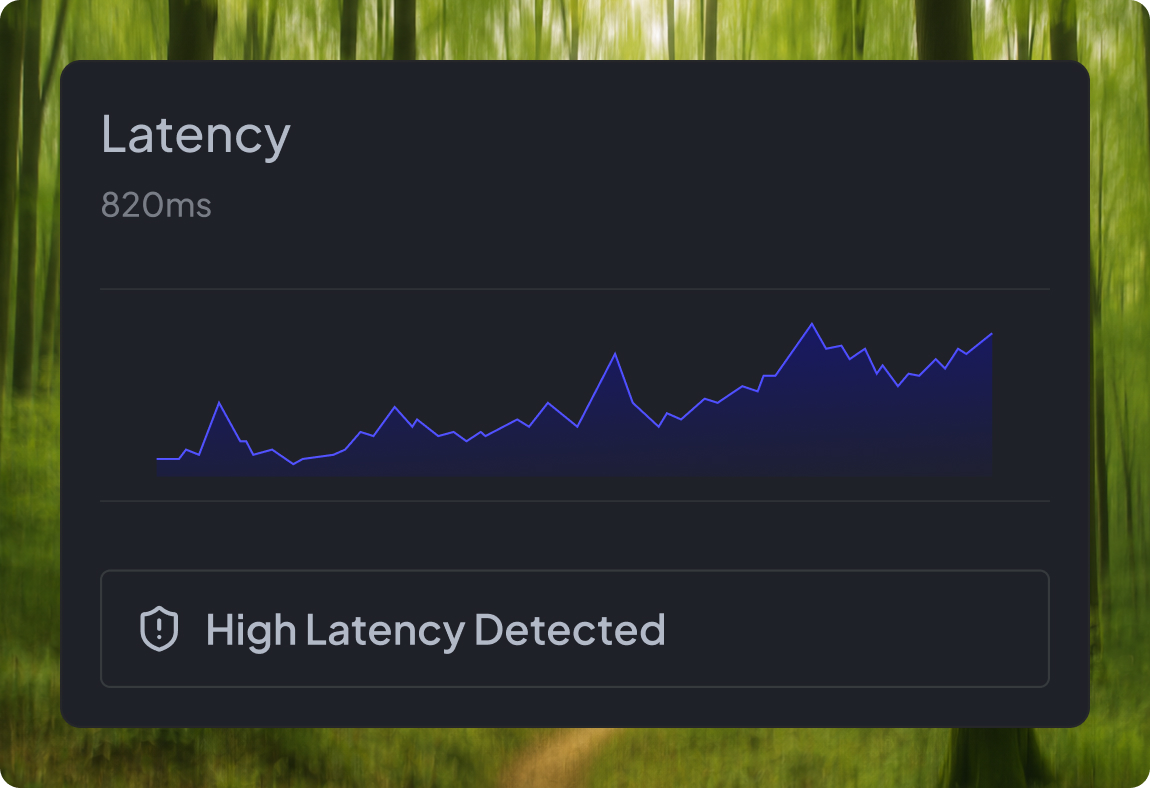
That’s the core problem with latency at scale: it doesn’t announce itself politely. It hides behind averages, lurks in tail percentiles, and compounds silently until one too many requests tips the whole system over the edge. Latency monitoring isn’t just about watching response times on a dashboard. It’s about building the observability muscle to understand how and where your system slows down, and catching it before your users do.
This post walks through the strategies that actually work for monitoring latency in high-traffic environments, from picking the right metrics to avoiding common traps in distributed systems.
Why Latency Becomes Exponential at Scale
Most engineering teams intuitively expect latency to grow in proportion to traffic. Twice the traffic, maybe 10–15% slower responses. But that’s not how real systems behave. In practice, latency remains relatively flat until a certain point, then skyrockets.
The reason is resource contention. When your system is running at 40% capacity, requests flow through without waiting. At 85%, every request is competing for the same CPU cycles, database connections, and memory. Here’s what compounds:
- Thread and connection pool exhaustion – When all available workers are busy, new requests queue up. Each queued request adds wait time not only for itself but also for every request behind it.
- Garbage collection under pressure – High memory use triggers more frequent and longer GC pauses, freezing request processing mid-flight.
- Cascading timeouts – A slowdown in one downstream service causes its callers to hold connections open longer, consuming their own pools and spreading the problem upstream.
- Serialization bottlenecks – Under heavy load, lock contention on shared data structures creates invisible chokepoints that don’t appear in any single service’s metrics.
Engineers who’ve dealt with this call it the latency cliff—the inflection point where a system flips from “healthy” to “on fire” in seconds, not minutes.
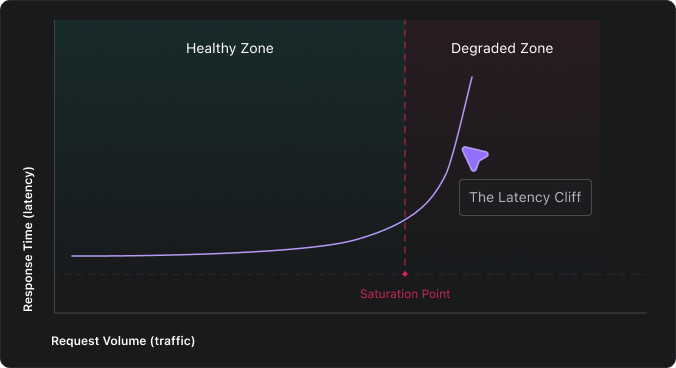
Application latency monitoring is what lets you see the cliff coming. Without it, the first sign of trouble is often an incident channel lighting up, by which point the damage is already done.
Key Latency Metrics That Actually Matter
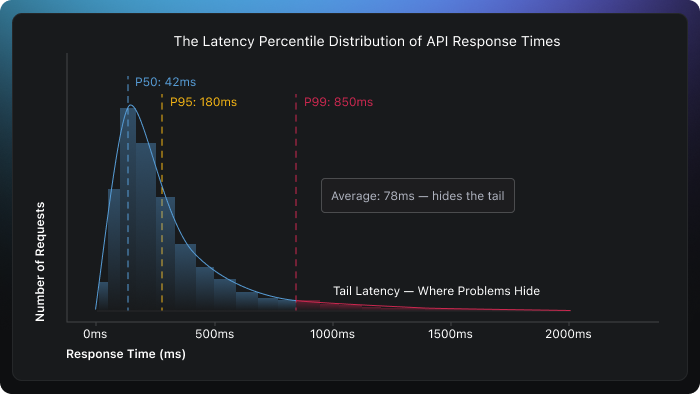
Here’s a mistake nearly every team makes early on: they track average response time, see a comfortable number like 75ms, and assume everything is fine. But averages can be misleading. They flatten the distribution and hide the fact that a meaningful chunk of your users might be waiting 2, 5, or even 10 seconds for a response.
If you want to understand what’s really happening, you need to look at the distribution of response times, not a single number.
The latency metrics worth tracking:
- P50 (Median) – What the typical request looks like. If this is healthy, the majority of your users are having a good experience.
- P95 and P99 (Tail latency) – The experience of your unluckiest users. In a system handling 1 million requests per day, P99 represents 10,000 slow requests; that’s not a rounding error, that’s a real problem.
- Time to First Byte (TTFB) – Measures how quickly your server starts responding. A high TTFB usually points to backend processing delays, slow queries, or overwhelmed application threads.
- Throughput-latency correlation – If requests per second are climbing but latency is climbing faster, you’re approaching saturation. This relationship is one of the earliest warning signals.
- Error rate alongside latency – A sudden rise in latency paired with increasing 5xx errors almost always means a dependency is failing, connections are being exhausted, or retries are compounding the load.
The right latency metrics don’t just tell you how fast your system is; they tell you how consistently fast it is across every user, endpoint, and time of day.
Building a Latency Monitoring Strategy for APIs and Microservices
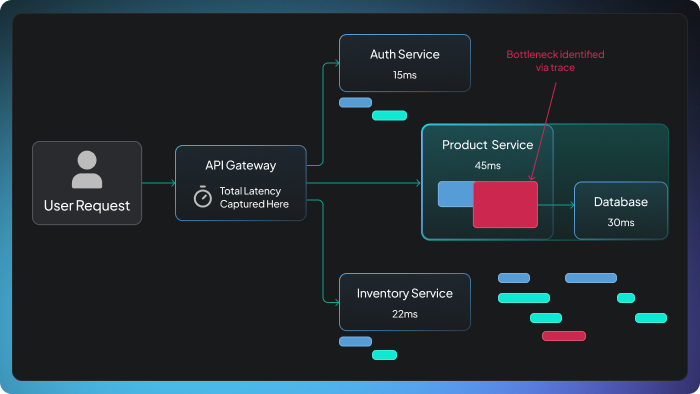
In a microservices architecture, one user-facing API call might fan out to a dozen internal services, each with its own database calls, external dependencies, and failure modes. Monitoring latency only at the API gateway is like measuring a relay race by timing only the last runner. You’ll know the total time, but you’ll have no idea which leg was slow.
A solid latency monitoring strategy needs layers:
- Start at the edge. Capture latency at the API gateway or load balancer. This is the closest measurement to what the end user actually experiences, including network transit time that server-side instrumentation completely misses.
- Add distributed tracing. Propagate trace context (using standards like OpenTelemetry’s W3C Trace Context) across every service hop. Distributed tracing lets you open up a single slow request and see exactly which service, query, or external call ate up the time.
- Set per-service latency budgets. Define explicit targets: e.g., “The recommendation service must respond within 40ms at P99.” When a service burns through its budget, you know immediately which component is dragging the overall response time.
- Layer in synthetic monitoring. Real-user traffic is great, but it has blind spots. At 3 AM on a Tuesday, you might have minimal traffic, and that’s exactly when a bad deploy, a certificate expiration, or a cold-start regression can sneak in. Synthetic probes fill the gap by simulating requests around the clock.
- Track baselines and trends, not just thresholds. A static alert that fires at 500ms tells you nothing about whether performance is trending in the wrong direction. Baselining per endpoint and alerting on percentage deviations from normal catches slow degradation that absolute thresholds miss entirely.
One practice that’s easy to overlook but incredibly valuable is to correlate latency changes with deployment events. If P99 jumped at 2:14 PM and a release went out at 2:12 PM, you don’t need a root cause analysis to know where to start looking.
Effective API latency monitoring doesn’t stop at the front door. It follows every request through every service, queue, and database call, giving you the visibility to diagnose problems in minutes instead of hours.
Detecting Performance Degradation Before SLA Violations
Traditional alerting is reactive by design. A threshold fires, you get paged, and you start investigating, but your users felt the impact long before your alert triggered. The shift toward proactive degradation detection is about buying yourself time: catching the trend before it becomes a breach.
Here’s the practical difference. A reactive alert says: “P99 exceeded 500ms.” A proactive signal says: “P99 has been drifting upward 15% over the last 20 minutes; at this burn rate, you’ll breach your SLO within 3 hours.”
Several techniques make this possible:
- Moving-window percentile drift – Instead of alerting on a single data point, track P99 over a rolling window (e.g., 15-minute EWMA). Alert when the trend is upward, even if the absolute value remains below the threshold. This gives your team a head start.
- SLO burn-rate alerting – Your monthly SLO might allow 0.1% of requests to exceed 500ms. If you’ve consumed 35% of that error budget in the first four days, something is wrong—even if no single minute looks alarming. Burn-rate alerts catch this slow bleed.
- Change-point detection – Employ statistical methods that identify when the distribution of latency shifts, not just when individual requests spike. This catches subtle, sustained degradation that point-in-time thresholds can’t see.
- Canary comparison – During deployments, continuously compare the latency distribution of canary instances against the stable baseline. If the canary is measurably slower, halt the rollout automatically before bad code reaches all users.
High-traffic performance monitoring at this level needs to be automated. No one can stare at dashboards when your system serves thousands of requests per second. Wire your detection into your SLI/SLO framework, connect it to your deployment pipeline, and let the system flag problems while your engineers focus on solving them.
Latency Monitoring Pitfalls in Distributed Systems
Even teams with sophisticated observability setups stumble into traps that quietly erode their monitoring effectiveness. Common pitfalls include:
- Trusting averages over percentiles. A P50 of 40ms and a P99 of 2 seconds produce an average that looks perfectly fine, even though 1% of your traffic is experiencing catastrophic delays. At 10 million daily requests, that’s 100,000 terrible user experiences hidden behind one comfortable number.
- Ignoring the client’s perspective. If your monitoring starts and stops at the application server, you’re missing DNS resolution, TLS negotiation, network transit, and client-side processing. Server-side latency might look great while the user waits 3 seconds for a response. Instrument from the client edge whenever possible.
- Monitoring at the wrong granularity. Tracking latency at the service level without breaking it down per-endpoint or per-dependency hides root causes. A blazing-fast /health endpoint averages out the pain of a struggling /search endpoint.
- Clock skew corrupting distributed traces. When clocks across nodes aren’t tightly synchronized, trace spans produce misleading results: child spans may appear to start before parent spans, or show negative durations. Enforce NTP or PTP synchronization across your fleet.
- Alert fatigue from poorly tuned thresholds. Too many low-value alerts teach on-call engineers to reflexively dismiss pages. Combine multiple signals (latency + error rate + saturation) and use burn-rate windows instead of single-point thresholds to dramatically improve signal quality.
The fix for all of these isn’t more dashboards or more tools. It’s more intentional instrumentation, understanding what you’re measuring, why you’re measuring it, and what actions you’ll take when the numbers move.
FAQ
What is the most important latency metric to track?
P99 tail latency is the most revealing single metric. It captures the worst experience your real users face and exposes problems that averages comfortably hide. While P50 shows baseline health, P99 tells you whether your system is reliably fast, or just fast for most people while silently failing others.
How do you monitor latency in microservices architectures?
Combine distributed tracing (using tools like OpenTelemetry) with per-service latency budgets and edge-level instrumentation at the API gateway. Tracing propagates context across service boundaries so you can follow a single request end-to-end, while latency budgets ensure no individual service silently degrades the overall response.
What causes sudden latency spikes in high-traffic systems?
Common triggers include garbage collection pauses under memory pressure, database connection pool exhaustion, downstream service timeouts that trigger retry storms, cold starts after deployments, and sudden traffic bursts that outpace auto-scaling. These factors often compound; one slow dependency can cascade across the entire request path.
How does latency monitoring relate to user experience?
Latency directly shapes how responsive your product feels. Even sub-second delays compound across multiple API calls and page interactions, increasing bounce rates and eroding trust. Users don’t diagnose the technical cause; they simply leave. Continuous latency monitoring ensures you detect degradation before it shows up in your churn numbers.