Outlier Detection
Outlier detection is the practice of identifying data points or events that don’t conform to normal behavior. These “odd one out” signals warn engineers about hidden problems such as faulty hardware, fraud, cyberattacks, performance slowdowns, or simple data-entry slip-ups. Detecting them quickly keeps data clean, analytics trustworthy, and customers unaffected.
Tools like Hud.io embed runtime monitoring directly into your production code and automatically detect errors and performance degradation, attaching deep forensic context so teams can quickly diagnose and fix issues.
Types of Outliers in Data Sets
Before you decide how to catch anomalies, it helps to know the shapes they can take. Each type needs a slightly different outlier detection technique:
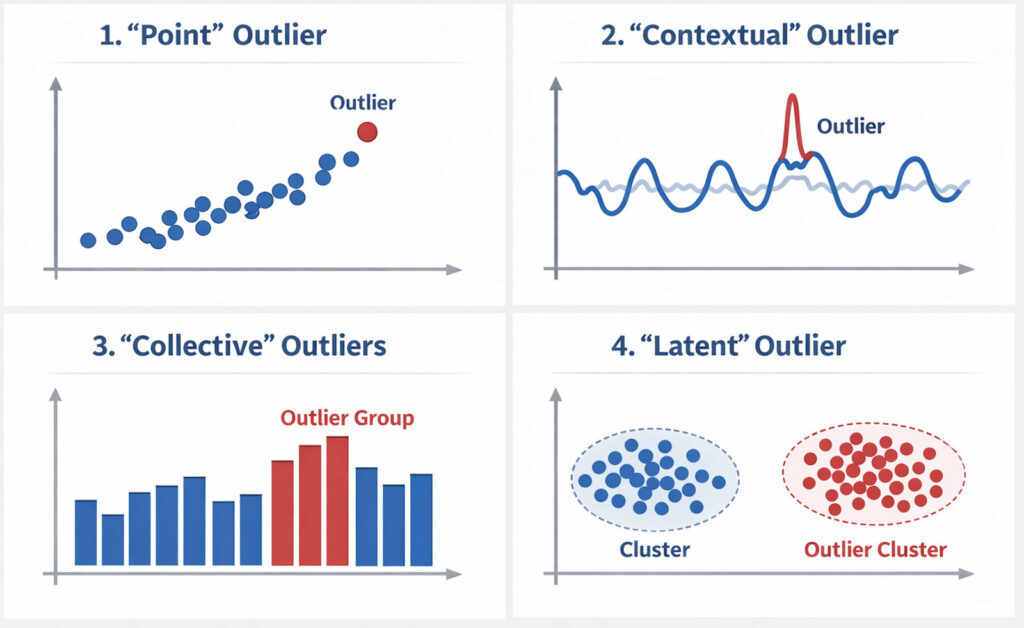
Global (Point) Outliers
One observation stands out from the others. For example, the time it takes for a database to respond goes from 50 ms to 5 s.
Contextual Outliers
A value is reasonable under one set of conditions but abnormal under another. Ten logins per minute from an admin account may be fine during working hours, yet suspicious at 3 a.m.
Collective Outliers
A small group of data points forms an unusual pattern, even though individual points might look normal. Think of several micro-services simultaneously emitting the same rare error code.
Subspace Outliers
The anomaly is visible only when you examine a particular subset of dimensions in high-dimensional data. Security analytics often uncover these when a user’s behavior appears normal overall but is odd in a narrow feature slice.
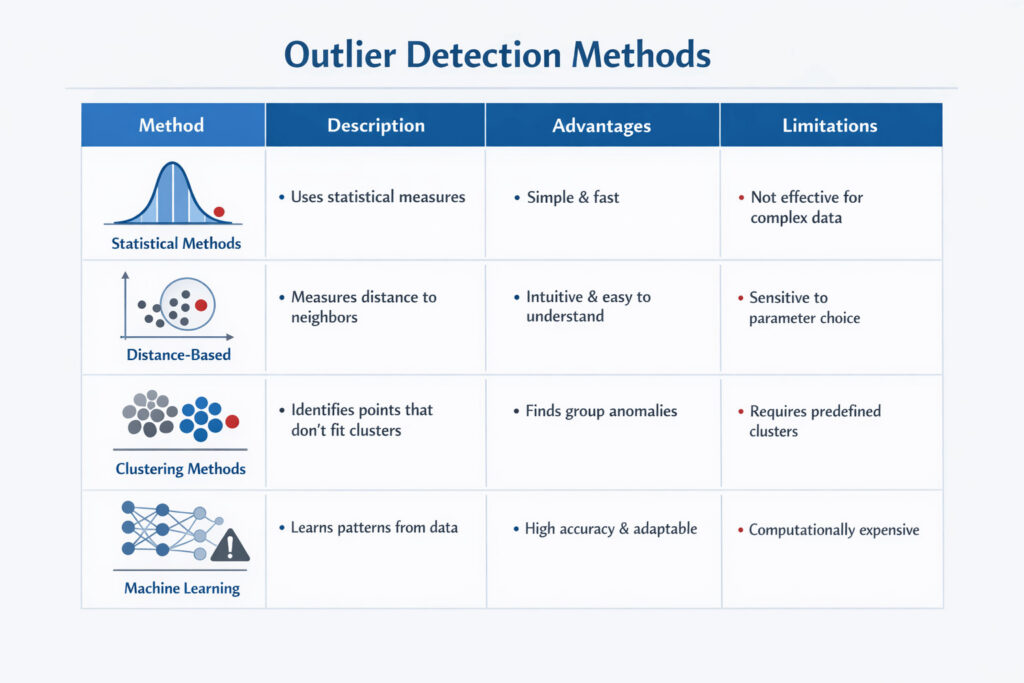
Outlier Detection Methods
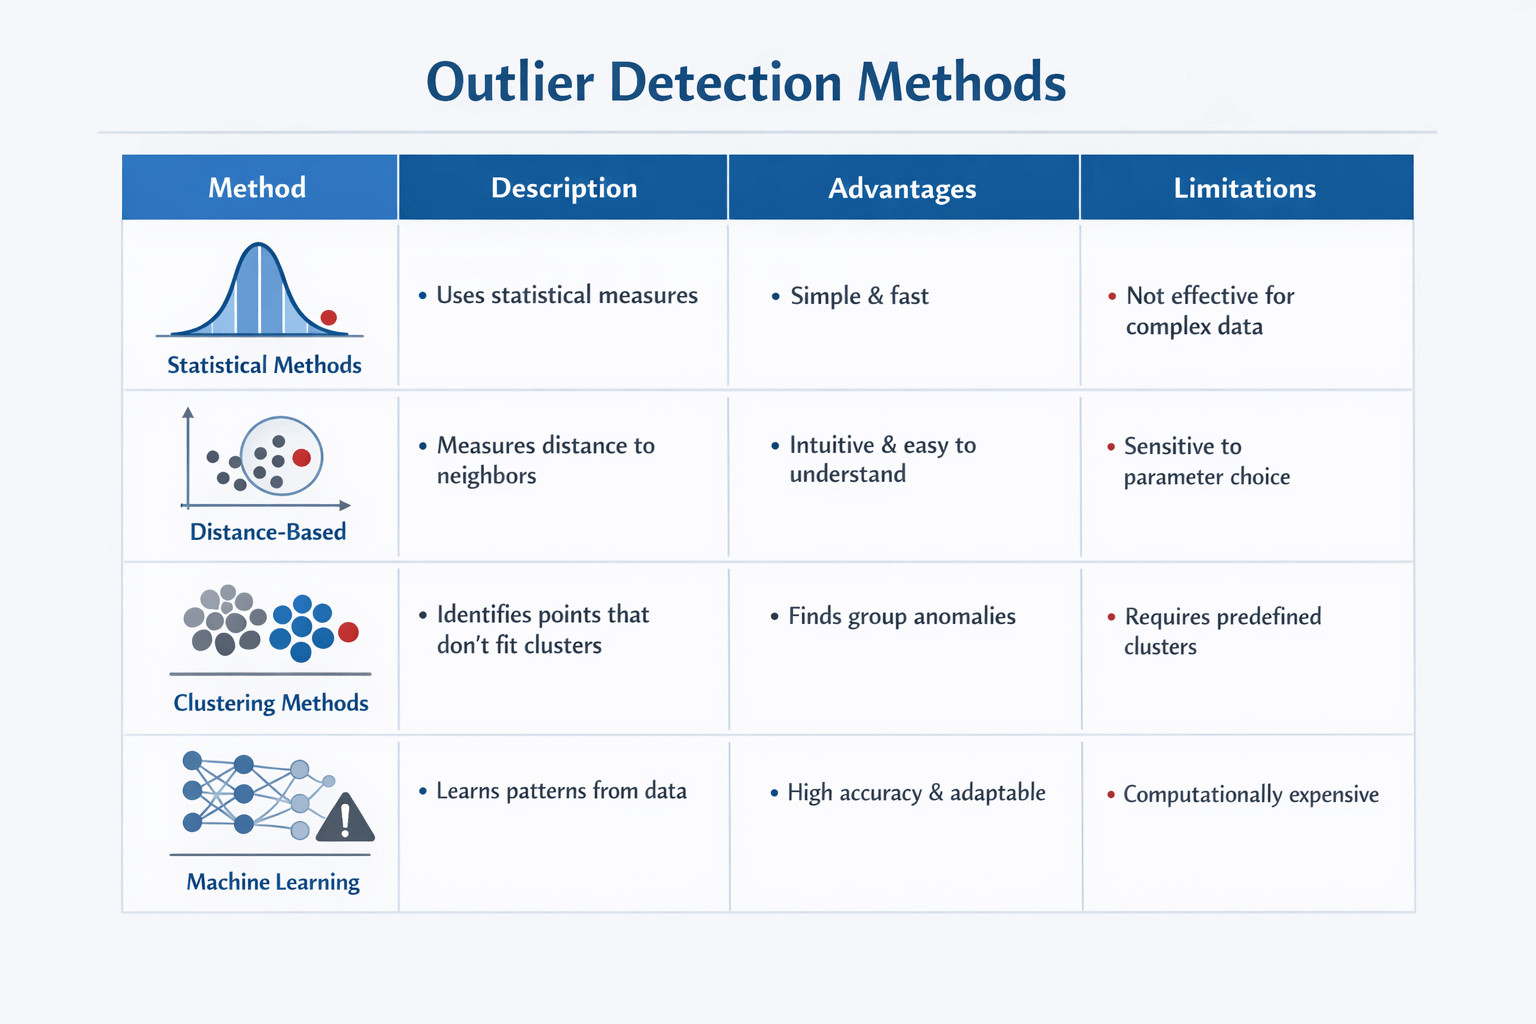
There isn’t one outlier detection algorithm that works for every situation. Choose your tool based on how big your data is, how fast it is, and how much explanation you need:
Statistical Approaches
Start here if your data roughly follows a known distribution.
- Z-Score/Standard Deviation – Flags any value more than about three standard deviations from the mean.
- Median Absolute Deviation (MAD) – This method uses the median instead of the mean, making it less sensitive to skewed data.
- Grubbs’ Test and Dixon’s Q – Hypothesis-testing procedures for small, univariate samples.
Distance & Density Algorithms
Good when you don’t know the data’s shape.
- k-Nearest Neighbours (k-NN) – Points with unusually sparse neighborhoods are deemed outliers.
- Local Outlier Factor (LOF) – Compares the local density of a point with that of its neighbors.
- DBSCAN – Clusters dense regions; objects left unclustered are potential anomalies.
Machine-Learning Techniques
Best for messy, high-dimensional streams.
- Isolation Forests – Randomly partition data; anomalies are isolated quickly with fewer splits.
- One-Class SVM – Learns a boundary around “normal” data in feature space.
- Autoencoders – Neural networks trained to reconstruct input; a high reconstruction error signals an outlier.
Probabilistic and Bayesian Models
Useful when uncertainty or time order matters.
- Gaussian Mixture Models – Assign very low-probability samples to an anomaly class.
- Hidden Markov Models (HMMs) – Spot improbable state transitions in time-series logs.
Real-Time and Streaming Considerations
Data is always moving, so your detector needs to keep up. New pipelines use methods that learn and send alerts in real time:
- Sliding Windows constantly reset baselines using the freshest observations.
- Incremental Clustering updates groups without full retraining.
- Sketches and Reservoir Sampling summarize fire-hose traffic in fixed memory.
- Streaming Isolation Forests adapt to concept drift without downtime.
Common Challenges in Outlier Analysis
Even the best algorithm can be tripped up by real-world chaos. Watch out for these pitfalls:
- High Dimensionality – In many dimensions, distance metrics lose meaning. Dimensionality-reduction methods or subspace algorithms help restore contrast.
- Concept Drift – The way a system works changes, making what was once an outlier normal. It is important to set adaptive thresholds and retrain the model regularly.
- Imbalanced Labels – Supervised models don’t perform well because rare events are underrepresented. Semi- or unsupervised methods often work better, and sometimes they are improved with synthetic oversampling.
- Noise Versus Signal – Random changes cause false positives. Combining multiple detectors and adding domain-specific rules can help reduce alert fatigue.
- Explainability – Black-box models make it hard to respond to incidents. Pick algorithms that show scores that can be understood, or use explainability tools like SHAP or feature importance with them.
Practical Use Cases
Outlier detection delivers value anywhere unexpected behavior hurts uptime, security, or user satisfaction.
- Fraud and Security – Unusual login locations or spending behaviors stand out quickly when distance-based models run continuously.
- IoT Sensor Health – Point outliers show broken devices, while collective outliers may show problems with the environment that affect a group of sensors.
- Business Analytics – Sales spikes outside seasonal patterns might signal promotional success, or, conversely, inflated metrics caused by bot activity.
Across domains, the pattern is similar: detect the unexpected early, supply context, then empower staff to act before customers notice.
Conclusion
Finding outliers is a mix of statistics, machine learning, and operational excellence. Whether you use a simple Z-score in a data-analysis pipeline or a runtime sensor like Hud.io that finds production problems in real time, the goal is always the same: to shine a light on the unexpected quickly enough to make a difference. Teams turn scary surprises into manageable insights by using sound methods and alerts that give them a lot of information.
FAQs
Why is outlier detection important for system monitoring?
Anomalies are often signs of hidden problems or attacks before they get worse. Catching them early helps keep SLAs, protect revenue, and keep users’ trust.
Tools such as Hud.io embed a Runtime Code Sensor into production that continuously captures structured, live behavior (performance metrics, error patterns, execution flows) and delivers that context to developers and AI tools for rapid insight.
How do false positives affect outlier analysis?
Engineers become less sensitive when there are too many false positives, which can lead to real problems being missed. Adaptive thresholds, ensembles, and alert correlation help balance sensitivity and specificity, ensuring the signal stands out from the noise.
Can outlier detection be automated in real time?
Yes. General streaming methods can quickly score metrics and find problems in data pipelines. Tools like Hud.io automatically record live runtime behavior directly from production, finding performance issues and bugs without any manual setup or configuration. They also give developers and AI tools rich, function-level context to help them diagnose and fix problems faster.
How does outlier detection support incident investigation?
Detection is only the first step; engineers also need context. Modern platforms attach stack traces, parameter values, and timing information to each anomaly. Hud.io enriches alerts with replayable snapshots, guiding teams from the anomaly marker directly to the offending code.