Most production issues start as small shifts. One call gets slower, retries kick in, or a database query becomes more expensive. If you only review logs after the fact, you end up piecing together what ran and when, hoping the timeline is accurate.
Code instrumentation gives you runtime evidence while real traffic runs. You add sensors inside the app so it emits telemetry you can trust, then you use that data to measure behavior instead of guessing.
Start with one service, validate the signals, and expand across the fleet once the data looks solid.
What Is Code Instrumentation?
Code instrumentation involves adding code or using agents to collect runtime data about application behavior. In observability work, instrumentation makes services produce signals such as traces, metrics, and logs.
This differs from monitoring. Monitoring focuses on dashboards and alerts. Instrumentation focuses on data generation inside the app. Without instrumentation, a monitoring tool only sees what the platform exposes, such as CPU, memory, and basic request counts.
Instrumentation also enables correlation. With consistent context propagation, signals from different services align under a single request context, including trace and span identifiers.
In instrumentation in software engineering, you decide what matters. You instrument the parts of the code in which time and failures hide, including payment, auth, search, and data access. Some teams refer to the agent or library layer as a coding instrument because it sits within the runtime and records behavior.
Types of Code Instrumentation: Manual vs. Automatic
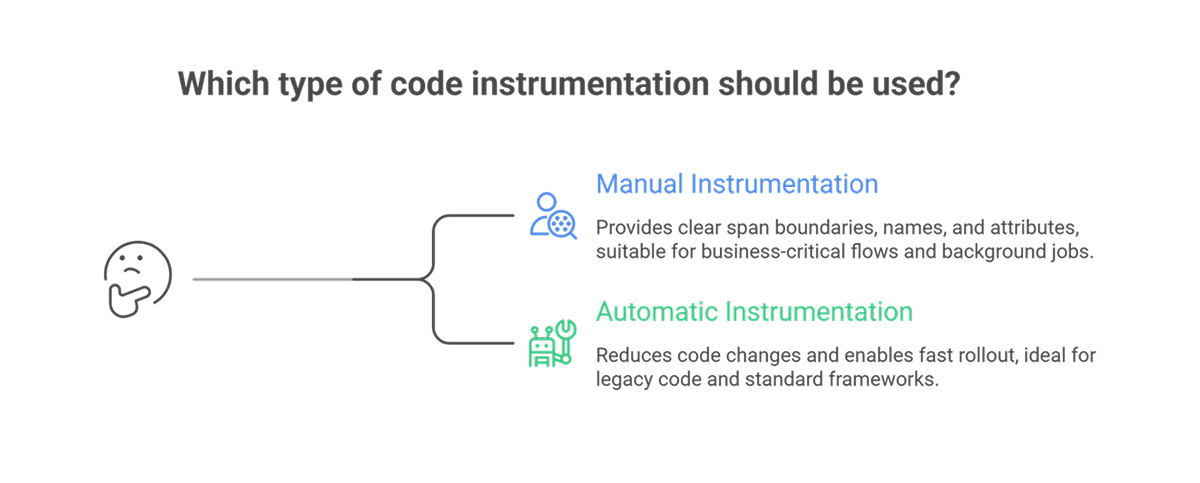
You have two common approaches: manual instrumentation, which involves inserting observability calls into your code, and automatic instrumentation, which means an agent or runtime layer adds instrumentation for you.
Manual instrumentation
Manual instrumentation uses an SDK to create spans, record metrics, and attach attributes. Manual work suits these cases:
- Business-critical flows where you need clear span boundaries, names, and attributes
- Domain context, such as cartId, tenant, plan, or payment provider response codes
- Background jobs where the default auto spans miss key phases
Manual instrumentation adds effort while you maintain the code. You review attributes for privacy and cardinality. You keep naming consistent across services.
Automatic instrumentation
Automatic instrumentation reduces code changes. An agent hooks into frameworks and libraries, then emits telemetry for HTTP clients, web servers, database drivers, and messaging libraries.
Under the hood, methods vary by language. Some use bytecode injection or monkey patching instead of source edits.
Automatic instrumentation suits these cases:
- Fast rollout across many services
- Legacy code in which direct edits carry risk
- Standard frameworks in which default spans already map well to requests and dependencies
A practical pattern works well in most teams. Start with automatic instrumentation to cover request paths and dependencies. Add manual spans for business operations, where names and attributes matter most.
What Data Does Code Instrumentation Collect?
Good instrumentation collects telemetry plus context to make telemetry useful.
- Traces show a request path across services. Each trace contains spans with start time, duration, status, and attributes. Context propagation ties spans together into a single request story across process and network boundaries.
- Metrics track trends. Instrumentation records counts, rates, and latency distributions. Typical examples include request rate, error rate, queue depth, and cache hit ratio. These metrics support alert rules and SLO reporting.
- Logs record events. When logs carry trace and span identifiers, logs link back to the trace view and speed triage.
Runtime and environment context
Instrumentation often adds:
- Service name, version, and deployment environment
- Route or operation name
- Dependency name and peer address
- Feature flag state
- Tenant, region, or customer tier labels
This context enables filters and comparisons during triage. The same context raises risk. High-cardinality attributes, such as userId on every span, increase storage and query costs. PII in attributes creates compliance risk. Treat attribute design as part of engineering, not an afterthought.
FAQs
What is the difference between manual and automatic instrumentation?
Manual instrumentation involves writing code to create spans and record metrics using an SDK. Automatic instrumentation relies on agents or runtime hooks that instrument popular frameworks without source edits. Many teams use both. Auto typically covers common libraries first, then manual adds business spans and domain attributes where precision is needed.
Does code instrumentation affect application performance?
Instrumentation adds overhead. Each request does extra work, and exporters send data over the network. Keep overhead low with sampling and batching, plus careful attribute choice. Test under load in a staging environment that replicates production traffic. Watch latency percentiles, CPU, memory, and export backlog.
How do you choose between manual and automatic instrumentation?
Pick automatic instrumentation for speed and broad coverage across many services. Pick manual instrumentation for key business flows, unusual code paths, and custom context. Start with auto to get visibility, then add manual spans where the trace view still feels vague during incidents and reviews.