Most teams already collect more telemetry than they can comfortably interpret during an incident. The problem is rarely a lack of data. It is the time it takes to turn that data into something useful while systems are still unstable.
That is where AI-driven observability has started to make sense for engineering teams. Not as a fancy layer on top of logs and traces, but as a way to sort through noisy signals, connect related symptoms, and surface patterns that are easy to miss when people are moving too fast.
What Is AI-Driven Observability?
Traditional observability gives teams the raw materials for investigation: logs, metrics, traces, events, dashboards, and alerts. That foundation still matters. Without it, there is nothing reliable to analyze. The issue is that modern systems generate too much of it, and incidents do not wait for someone to manually compare five dashboards, three deploy timelines, and a stream of application errors.
AI-driven observability uses models to help with that first round of interpretation. Instead of showing only raw telemetry, the system looks for relationships across services, changes, and time windows. It can point out that a rise in checkout latency began shortly after a configuration rollout, or that several alerts from different services are all tied to one degraded dependency. The value is not that it magically explains everything. The value is that it gives engineers a better starting point.
This is also where people confuse AI observability with model observability in machine learning systems-they are related ideas, but not the same thing. In this context, AI observability is about using AI techniques to understand software and infrastructure behavior, not just tracking the performance of AI models in production.
How AI Observability Works: From Data to Insights
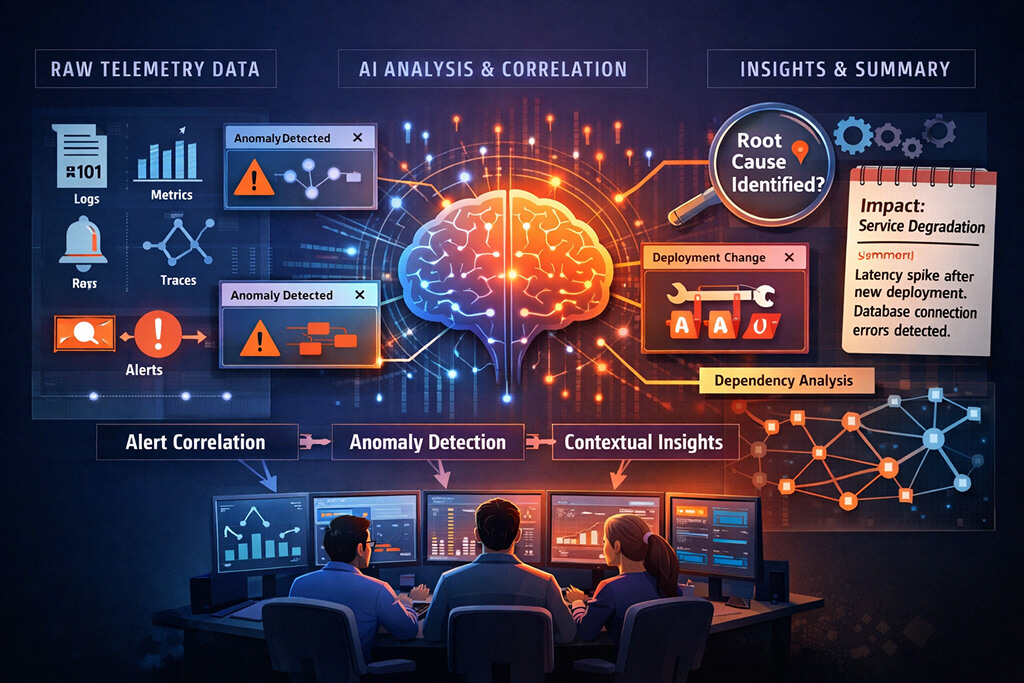
The underlying workflow is fairly practical. Telemetry comes in from the usual places: application logs, infrastructure metrics, distributed traces, deployment events, cloud service health, queue depth, error rates, and whatever custom signals a team already emits. A traditional monitoring stack stores and visualizes that information. An AI layer tries to make sense of it across systems and over time.
Usually, that starts with correlation. The system lines up unusual events, groups related alerts, and checks what changed near the onset of a problem. From there, it may compare current behavior against historical baselines, identify anomalies, and rank likely sources of failure. A request timeout in one service might not matter on its own, but when combined with trace slowdowns, a new release, and a spike in downstream connection errors, it becomes much more meaningful.
Generative models are sometimes added to that pipeline, mostly for summarization and explanation. They can turn raw evidence into a short incident narrative that reads more like an engineer’s first note than a wall of telemetry. That can be genuinely useful, especially for responders who join an incident late. It can also be misleading if the summary sounds more certain than the evidence supports. Good systems show the reasoning trail, not just the polished conclusion.
Key Capabilities of AI Observability Platforms
Most AI observability platforms are not replacing dashboards. They are trying to reduce the manual effort required to detect a signal in a noisy environment. The useful capabilities tend to be fairly grounded.
- Alert grouping – Collapses related symptoms into fewer incidents so teams are not chasing the same failure from multiple directions.
- Anomaly detection – Flags behavior that drifts from normal patterns, including issues that may not cross a static threshold yet.
- Change correlation – Links incidents to deploys, feature flags, config edits, or infrastructure updates that happened close to the start of degradation.
- Service dependency analysis – Helps trace how a problem spreads across services, so teams can find where it started rather than where it became visible.
- Incident summarization – Produces short, readable context from raw telemetry to support handoffs and post-incident review.
Those capabilities matter because most operational pain is repetitive. Teams waste time deciding whether two pages are related, checking whether a rollout aligns with an error burst, or trying to figure out which service is the actual source rather than the loudest victim. AI-powered observability is useful when it shortens that loop without hiding the underlying evidence.
The best results usually come from environments with decent telemetry hygiene. If traces are sampled too aggressively, logs are inconsistent, and deploy metadata is missing half the time, the system will still generate insights, but they may not be worth much. Models are very good at sounding organized. That is not the same as being right.
AI-Driven Observability vs. Traditional Monitoring
Traditional monitoring still does an important job. Static thresholds, dashboards, and service-level alerts remain the basic control surface for production systems. They are predictable, cheap to reason about, and often enough for known failure modes. A disk filling up or a CPU spike after a bad deployment does not require much intelligence to detect.
The difference lies in what happens after detection. Traditional monitoring tells you something is wrong. AI-driven observability tries to explain why it might be wrong and where to look first. That does not remove the need for human investigation, but it can reduce the time spent on low-value searching. The distinction matters because incidents rarely fail in neat ways. Symptoms spill across services, secondary effects bury the original cause, and the first alert is often not the most useful one.
There is also a trust gap between the two approaches. Engineers know how a threshold alert works. They can see the metric, the condition, and the trigger. An AI system needs to earn that same trust by exposing evidence clearly. If it offers a confident summary without showing the log cluster, the trace pattern, or the change event behind it, teams will quickly ignore it. That is why the better systems feel more like investigation assistants than decision engines.
Final Thoughts
AI-driven observability is useful when it stays close to normal engineering work. It should help teams move from noisy telemetry to a workable hypothesis faster, not pretend that production systems can explain themselves. When the data is solid, and the tooling clearly shows its evidence, it can save time without changing how effective an investigation actually is.
FAQs
1. What kind of insights can AI-powered observability surface that manual analysis misses?
AI-powered observability is good at finding patterns that are easy to miss when data is scattered across systems. It can connect a latency increase to a recent deploy, identify that several alerts belong to one dependency failure, or spot early drift that has not yet triggered a conventional threshold but still points to a real issue.
2. Does AI-driven observability replace the need for human judgment in incident response?
No. It reduces the time spent gathering and ranking evidence, but it does not understand business impact, operational context, or system quirks the way experienced engineers do. During incident response, human judgment is still needed to validate whether a suggested cause explains the failure and to decide what action is safe.
3. How does AI-driven observability reduce alert fatigue?
It reduces alert fatigue by grouping duplicate or closely related alerts, suppressing noise from secondary failures, and highlighting the few signals most likely connected to the primary issue. That changes the experience from reading an alert flood to working from a narrower, more coherent incident picture.