Factories, data centers, and other high‑volume operations never stop moving. Sensors beep, machines spin, and software processes thousands of requests every second. Production monitoring turns all that activity into clear, live information. It gives managers and engineers a real‑time view of where work is flowing smoothly and where it is slowing down, warns them before machines or services fail, and helps keep output, quality, and costs on track.
What Is Production Monitoring?
Production monitoring is the process of gathering, displaying, and analyzing data from live production systems to quickly identify problems and continuously improve. In software, this could involve tracking API latency, error rates, and user load. A modern production monitoring platform brings these signals onto one screen so everyone from the shop floor to the boardroom can see whether daily production goals are being met.
The main point is to measure what is happening now, not what happened yesterday. When operators and engineers can identify problems early, they can fix them before they become major issues that lead to missed deadlines or unhappy customers.
Key Metrics Used in Production Monitoring
A modern production monitoring dashboard tracks more than just system health. It combines infrastructure metrics and application behavior. When AI models are involved, signals about data quality, model performance, and business impact. Together, these metrics show not only whether a system is running, but whether it is producing the right results.

Below are common metrics you’ll find on a production dashboard.
- Throughput – Measures the volume of work completed per time unit (e.g., API requests/s or model predictions/s). Sharp dips usually point to a bottleneck; unexpected spikes can overwhelm downstream services or inference pipelines.
- Latency (p50, p95, p99) – Records how long a task takes, even the slowest “tail” requests. When tail latency goes up, it usually means that resources are running out, code paths aren’t working well, or models can’t keep up with demand.
- Error Rate & Failure Types – Keeps track of how often and why operations fail (5xx responses, timeouts, invalid inputs, prediction errors, etc.). For AI systems, this also includes model-execution errors or inferences that were rejected because features were missing or in the wrong format.
- Availability/Uptime – Shows how often the system gives the right answers. This metric is usually directly linked to SLOs and contractual commitments for services that are important to customers or safety.
- Saturation (Resource Utilization) – Monitors proximity of critical resources (i.e., CPU, memory, GPU, thread pools, queues, and I/O) to their limits. High saturation raises the odds of latency spikes or dropped requests, especially during peak inference or batch windows.
- Data Drift & Behavioral Change – Compares current production data to past baselines or training sets. Changes in feature distribution, user behavior, or the environment can make a model perform worse, even if the infrastructure looks fine.
- Data Quality & Input Health – Checks whether the incoming data meets expectations. Analytics pipelines can break, or models can become less accurate over time due to missing values, schema changes, inputs that are too high or too low, or data feeds that arrive late.
- Model Performance & Accuracy Signals – Observes model outputs in production; accuracy once ground truth arrives, confidence scores, prediction-distribution stability, etc. Variations often reveal issues invisible to infrastructure metrics alone.
- Dependency & Downstream Health – Checks the health of APIs, message queues, databases, and feature stores. These dependencies are the cause of many incidents, and their latency or failures directly affect end-to-end performance.
- Deployment & Release Impact – Compares metrics before and after code, configuration, or model changes. Rapidly surfaces regressions so teams can roll back releases that harm performance, accuracy, or business outcomes.
Production Monitoring vs. Development Monitoring
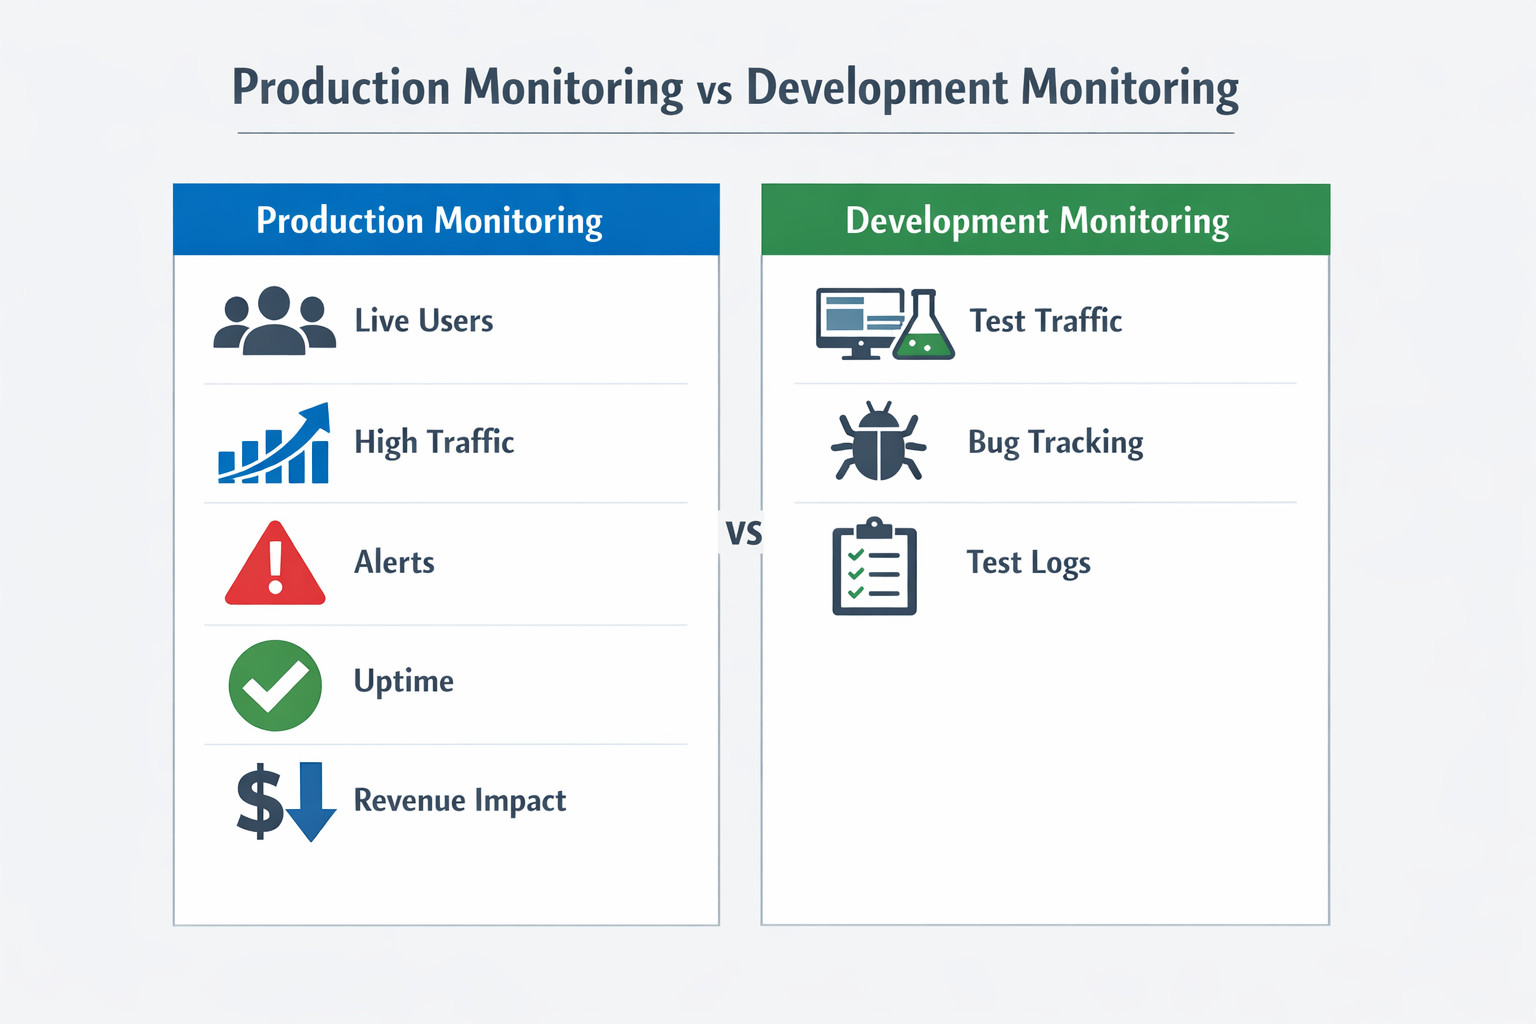
- Stage of Lifecycle: Production monitoring watches live systems used by customers. Development monitoring keeps an eye on pre‑production or staging environments.
- Primary Goal: Production cares about uptime, speed, and quality. Development focuses on finding bugs and validating new code.
- Data Volume: Production streams a huge, continuous flow of metrics. Development traffic is lighter and mostly bursts during tests.
- Typical Users: Operations engineers, line supervisors, and SREs rely on production dashboards. Developers and QA testers lean on development metrics.
- Risk of Failure: A slip in production can cost revenue and harm reputation; a slip in development mainly delays the next release.
Benefits of Real‑Time Production Monitoring
- Faster Issue Detection: In modern software and AI-driven environments, tools like Hud.io extend production monitoring beyond surface-level metrics by capturing real-time, function-level execution data from live systems. This helps teams understand not just that something slowed down or failed, but why it happened in production.
- Higher Uptime: Predictive analytics monitors CPU, memory, queue depth, and error rates to detect spikes. This gives SREs time to add capacity, tweak settings, or reroute traffic to meet SLAs.
- Cost Savings: Finding memory leaks, runaway batch jobs, and underutilized servers early on reduces cloud costs and prevents costly firefighting.
- Better Decision‑Making: Trend data across releases, regions, and feature flags shows which versions perform best. This helps with capacity planning and performance tuning that is based on facts, not guesses.
- Continuous Improvement: DevOps teams can A/B test a change, see latency and error deltas in real time, and promote the winner within minutes, turning quick feedback into steady gains.
How a Production Monitoring Platform Works
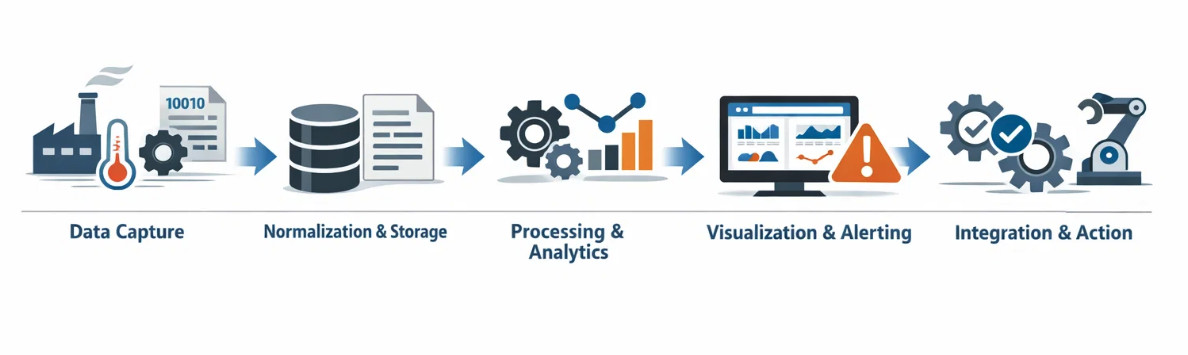
- Data Capture – Sensors, PLCs, log files, and application agents send raw data (such as temperature, cycle counts, and API calls) to the cloud or to on-premises servers.
- Normalization & Storage – Data is assigned a timestamp and a label (such as a machine ID or product code), and stored in a time-series or relational database.
- Processing & Analytics – ETL jobs calculate KPIs (such as OEE), identify anomalies, and send data to machine learning models to predict failures.
- Visualization & Alerting – Dashboards show live gauges and sparkline trends. When thresholds are breached, alerts are sent to email, SMS, or chat.
- Integration & Action – APIs or webhooks trigger maintenance tickets, reorder raw materials, or auto‑scale cloud resources.
Conclusion
Whether you run presses and conveyors or containers and Kubernetes pods, production monitoring keeps your operation on track. A modern production monitoring platform delivers live metrics, smart alerts, and historical insights that translate directly into higher uptime, lower costs, and happier customers. Start by tracking a few key metrics, then expand, and you’ll quickly wonder how you ever flew blind.
Frequently Asked Questions
What data is collected in production process monitoring?
A software-centric monitoring stack ingests system metrics (CPU, memory, I/O), application metrics (throughput, latency, error codes), distributed traces, structured logs, and orchestration events from containers or serverless runtimes. Pulling these signals together lets engineers connect user actions, code paths, and infrastructure health in one place.
How does keeping an eye on production make operations run more smoothly?
Real-time visibility cuts the average time to find and fix (MTTD/MTTR). When the load increases, teams can automatically scale, fix slow queries, or roll back a bad build in minutes rather than hours. With fewer problems and quicker fixes, engineers can spend less time putting out fires and more time adding new features.
Can production monitoring help predict system failures?
Yes. Baseline models and anomaly-detection rules watch for leading indicators like rising retry counts, garbage-collection pauses, or queue backlogs. Early warnings trigger runbooks or automated remediation, such as restarting pods, shifting traffic, or provisioning new nodes, before users experience an outage.
How does a platform for monitoring production help with scalability?
Cloud-native platforms gather millions of data points every minute, automatically shard storage, and expose APIs that integrate with auto-scaling groups and CI/CD pipelines. The monitoring layer grows horizontally as you add customers, microservices, or regions, so you don’t have to redesign it.