Production issues rarely arrive with a clean repro. Real traffic brings odd inputs, race conditions, and slow dependencies. When customers report failures, you need quick answers, without adding risk to a live system.
Production debugging is the process of identifying the causes of failures and performance regressions in a live environment, then shipping a safe fix. During an incident, the first target is stability. After stability, attention turns to root cause and prevention.
What Is Production Debugging?
Production debugging means investigating problems using evidence from running services. Most teams rely on a mix of signals:
- Error reports with stack traces and grouping
- Logs tied to a request, user flow, or job run
- Metrics for rate, latency percentiles, and saturation
- Traces that show one request across multiple services
- Release and flag context for version comparisons
Good production debugging also includes a disciplined loop: Form a hypothesis. Validate it with evidence. Apply the smallest change that reduces impact. Confirm the outcome with the same signals. Remove temporary debug code once the incident ends.
The idea of debugging in a production environment sounds risky because many engineers picture breakpoints and step-through sessions. Production debugging relies on safer techniques that avoid disruption.
Why Production Debugging Is Challenging
When you work on production, you have to deal with problems that don’t happen when you debug locally.
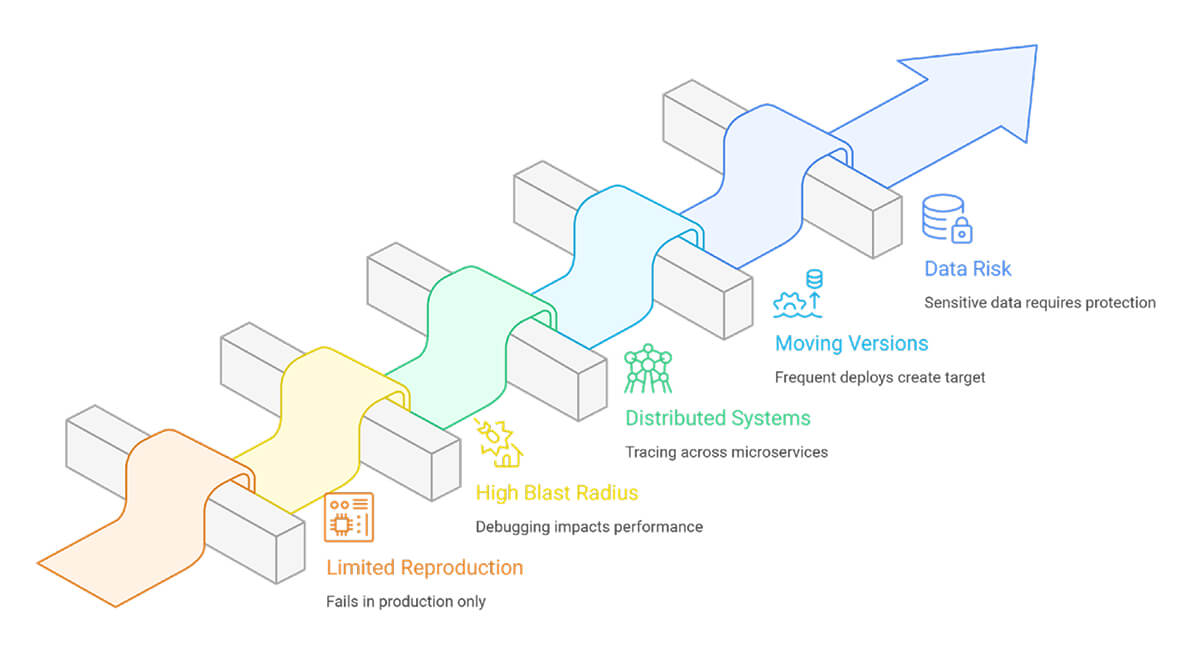
- Limited reproduction: Many failures depend on timing, load, concurrency, or a specific dependency response. A local copy rarely meets those conditions.
- High blast radius: A poorly implemented debugging step can slow requests, increase memory usage, or leak sensitive fields into logs. Small overhead becomes visible at scale.
- Distributed systems: Microservices spread a single user action across multiple hops. A timeout in a downstream service often surfaces as a 502 at the gateway. Without a trace context, teams chase symptoms.
- Moving versions: Frequent deploys and feature flags create a moving target. A report from this morning might relate to a different version by afternoon. Version tags and flag states need to appear in every signal, or comparisons become guesswork.
- Data and compliance risk: Production holds real accounts, tokens, and business records. Debug output needs redaction, guardrails, and rigorous access control.
Production Debugging Techniques and Approaches
1. Triage with metrics and failure rates
Confirm the impact and identify where the issue concentrates. Slice by route, service, region, tenant, and release version. Track p50, p95, and p99 latency, not only averages.
2. Follow one failing request end-to-end
Use distributed tracing to inspect a failing request. Find the slowest span and the first error. Look for retries and timeouts that stretch latency. When tracing is missing, propagate a request ID through every hop and log it everywhere.
3. Improve logs for search, not volume
Prefer structured logs with stable fields. Useful fields include route, dependency name, error type, status code, and release version. Avoid dumping payloads. Record small facts that explain state changes.
4. Compare across releases and flags
Compare behavior across versions and feature flag states. Roll back a risky flag without rolling back the full deploy. Route a small cohort to verify a fix before a wider rollout. Keep a brief timeline of changes during the incident so the team can tie symptom shifts to concrete events.
5. Treat dependencies as first-class citizens
Add strict timeouts. Cap retries. Add jitter. Use circuit breakers and fallbacks for non-critical calls. Record dependency latency and error codes as trace attributes to keep root-cause work focused.
6. Add automation and AI with clear boundaries
An automated production debugging tool groups similar errors, links traces and logs, and surfaces release regressions. AI for production debugging helps with clustering, summaries, and pattern surfacing across tenants. Keep humans in control of shipping decisions. Verify outputs versus traces, logs, and metrics.
FAQs
How is production debugging different from development debugging?
When development debugging, you usually reproduce the issue, attach a debugger, and step through the code until you see what went wrong. In production, that workflow breaks down. You investigate using traces, structured logs, metrics, and error reports from real traffic. You also work under strict limits on overhead and data exposure.
Are breakpoints suitable for production debugging?
Breakpoints halt execution. Under load, that leads to timeouts and clogged worker threads. Most teams avoid them in live services. Use safer tools instead, such as sampled debug logs, non-blocking stack snapshots, and low-overhead profiling. Keep access locked down, and gate diagnostics behind flags.
How does runtime intelligence help with production debugging?
Runtime intelligence shows how code behaves under real workloads. It helps you compare versions, identify the slow path in a request, and see which feature flag or segment is linked to failures. You use that context to narrow the suspected change faster and confirm the fix after rollout.