Kubernetes CPU Throttling
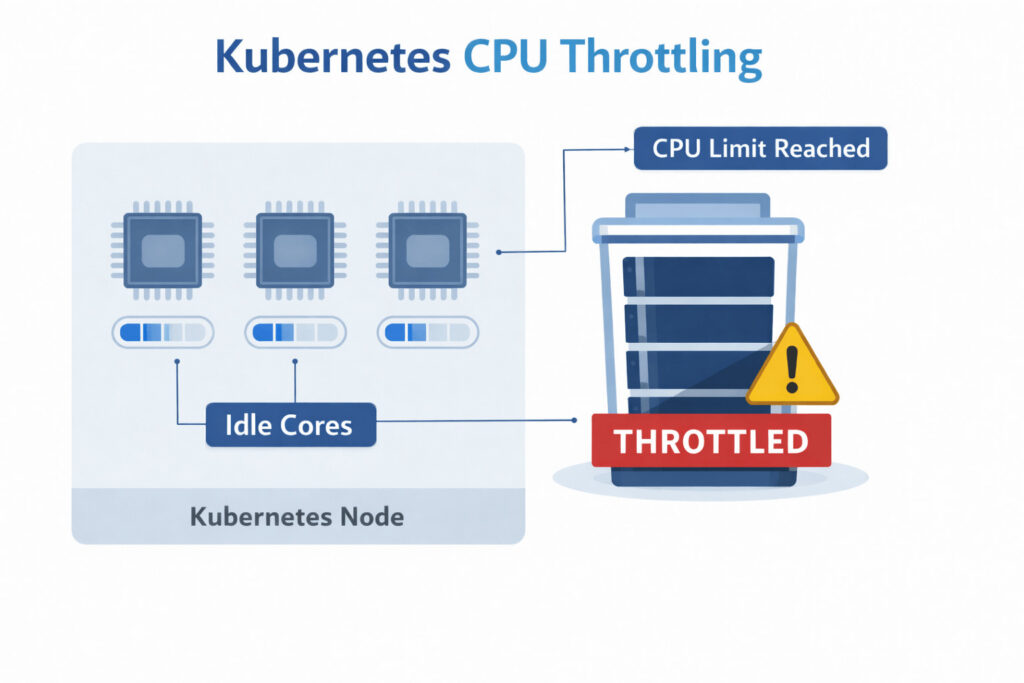
When a container tries to use more CPU time than the amount granted by the scheduler, the Linux kernel “throttles” the process, forcing it to pause until the next scheduling window.
In Kubernetes, this happens whenever a pod’s cpu limit is met or exceeded. Throttling is not the same as high utilization: a container can be throttled even while the node still has idle cores.
How CPU Throttling Works in Kubernetes
Picture every container in a Kubernetes pod as a runner on a circular track. The track marshal (the Linux kernel) blows a whistle every 100 milliseconds to mark the start of a new lap. How long each runner is allowed to sprint during that lap is set by the pod’s CPU limit:
- 1 CPU limit → 100 ms of running per lap
- 0.5 CPU limit → 50 ms of running per lap
- No limit → run the whole lap without restriction
As the lap unfolds, the marshal keeps a stopwatch for each runner. The moment a runner’s budgeted time is used up (say they’ve sprinted for 60 ms when their allowance is only 50 ms), the marshal makes them step off the track and wait until the whistle blows again. This forced wait is CPU throttling. This mechanism protects noisy neighbors but can bite latency-sensitive services.
Common Causes of Kubernetes CPU Throttling
When you start seeing long or frequent “hiccups” from CPU throttling, it’s almost always because one or more of the following are happening:
1. Aggressive CPU limits
Setting limits equal to requests is tempting for cost control, yet bursty workloads need headroom. Io-heavy micro-services that spike during cache warm-ups often trigger throttling minutes after deploy.
2. Mismatched thread counts
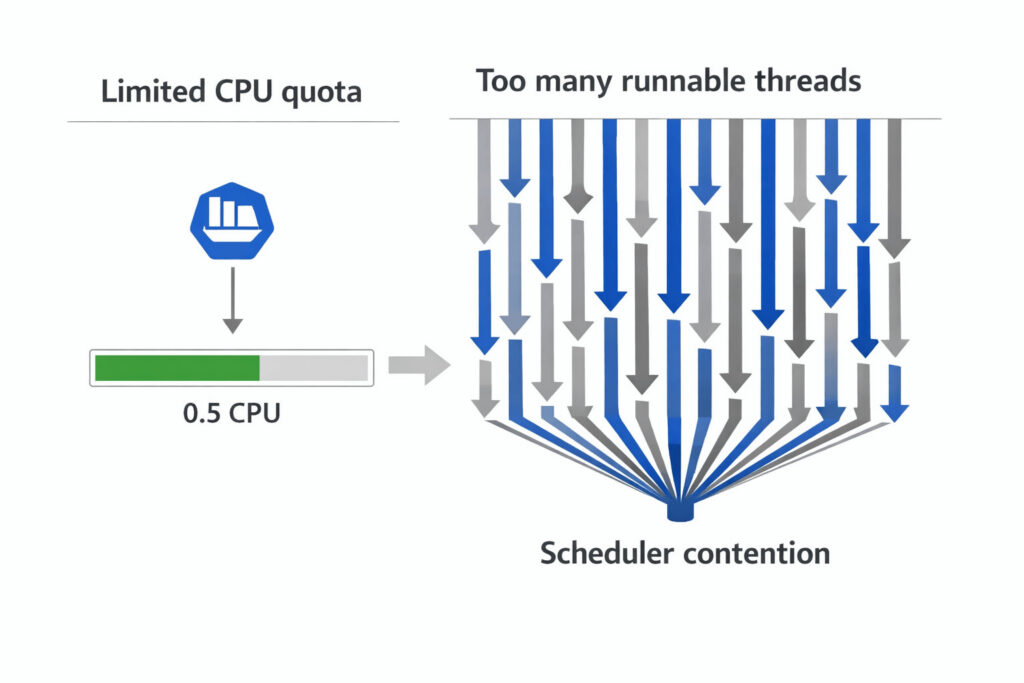
Mismatched thread counts
Java, .NET, and Go apps often default to N = vCPU threads. If the pod is limited to 500 mCPU on a 16-core node, it may spawn 16 run-queues but only be allowed ½ a core, leading to chronic stalls.
3. Background GC or JIT activity
Garbage collectors and Just-In-Time compilers are CPU-hungry. When they coincide with a traffic surge, they burn through quota fast.
4. Node over-commitment
Kubernetes lets you schedule more requested CPU than physically exists. If many pods hit their limits simultaneously, they all stall in turn, and latency balloons.
5. Burstable overproduction
Pods in the Burstable QoS class whose requests are tiny but limits are significant can overwhelm other Burstable pods on the node, contributing to widespread throttling and latency spikes.
In real environments, several of these causes often overlap. Tools such as Hud.io help teams identify which factor is actually responsible by analyzing throttling patterns alongside QoS class, deployment changes, and workload type.
How to Detect Throttled CPU in Production
You can’t fix what you can’t see. Luckily, modern observability stacks expose precise Kubernetes cpu throttling metrics. By tracking these five items, teams can quickly identify Kubernetes CPU throttling and correct it before users notice a slowdown.
1. container_cpu_cfs_throttled_seconds_total
This counter shows the total time, in seconds, that the kernel has paused a container. Plot it as a line. A sudden increase after a deployment or traffic rise indicates new throttling.
2. container_cpu_cfs_throttled_periods_total
This value counts the number of 100-millisecond scheduling periods that ended with throttling. Many periods with little total time suggest quick, frequent pauses. Fewer periods with high total time are associated with longer pauses. Comparing this metric with the previous one reveals the throttle pattern.
3. Ratio alerting
Divide throttled seconds by total CPU seconds (container_cpu_usage_seconds_total). Using a ratio keeps the rule consistent across small and large nodes.
4. Flamegraphs & profiling
When an alert triggers, run a brief profile during the throttle window. A flamegraph shows which functions use the most CPU. If request-handling code dominates, raise the limit. If background tasks such as garbage collection dominate, tune the application.
5. Cost dashboards
Cost Dashboards
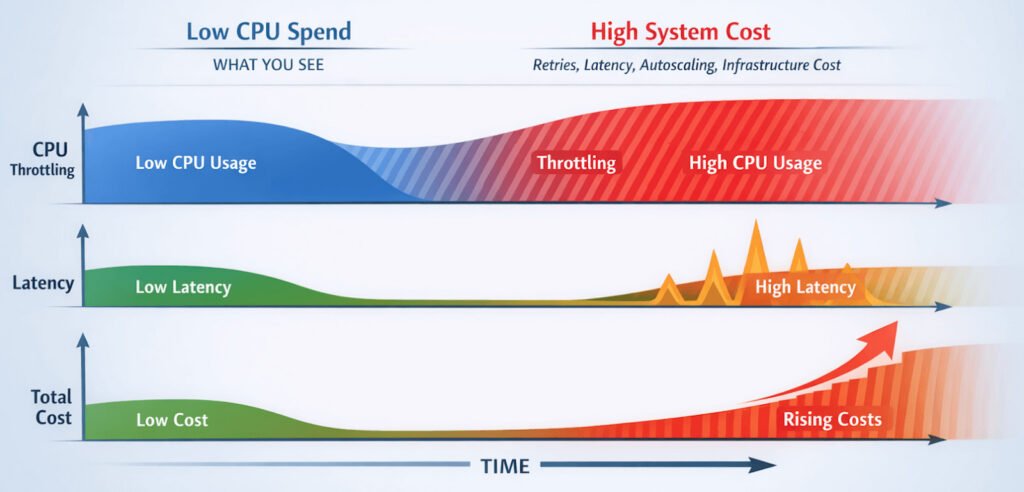
Throttling can lower CPU bills but increase retries and latency, creating a hidden Kubernetes CPU throttling cost that only shows up when performance and spend are analyzed together.
Platforms such as Hud.io make this correlation practical by placing CPU throttling, latency, and infrastructure cost on a shared timeline. So teams can clearly see when relaxing limits improves both performance and spend.
FAQs
How can CPU throttling affect application latency?
CPU throttling injects forced sleep intervals at the scheduler level, stalling every request that touches that core. Although each pause lasts only a few milliseconds, the cumulative effect directly inflates end-to-end latency, amplifies jitter, and can shatter tail-latency SLOs across chatty micro-services, fan-out patterns, or latency-sensitive real-time APIs in distributed systems.
Is CPU throttling always a misconfiguration?
No. A small amount of throttling can be an intentional cost-efficiency tactic. Platform teams sometimes allow 2–3% throttled time to pack more workloads onto each node without breaching user-facing SLOs. The trick is to measure tail latency and roll back immediately if customers notice extra lag.
How do CPU limits impact autoscaling behavior?
The HPA judges demand by dividing the actual CPU usage by the CPU request you set. Tight requests push that ratio toward 100%, triggering scale-outs early and often, wasting resources. Excessively high limits do the opposite, masking spikes and delaying the creation of new pods. Choose realistic limits to keep scaling smooth.
Can monitoring tools reliably detect CPU throttling issues?
Yes. Kernel-level counters are unambiguous. The challenge is context: you still need to correlate throttling with request latency, error rates, and cost. A well-instrumented stack like Hud.io’s pairs CFS metrics with business SLIs to surface only the throttling that genuinely matters.