It’s easy to share a cluster with many teams and workloads using Kubernetes. But that ease can hide a hard truth: CPU time is limited. If one pod takes too much of it, every other service on the node slows down.
What Are Kubernetes CPU Limits?
A CPU limit is an upper bound on the CPU time a container can consume, expressed in units of CPU cores. In Kubernetes, you set it in a pod or container manifest under resources.limits.cpu, usually as a fraction of a core (for example, 500m for half a core) or an integer (such as 2 for two full cores).
Setting a limit signals to the Linux CFS (completely fair scheduler) that a cgroup should be throttled once it exceeds its quota over a 100 ms period. The container then pauses until the next scheduling slice. Limits, therefore, protect noisy neighbors from monopolizing shared hardware; a critical guardrail when many applications, CI jobs, and cron tasks co-exist on the same shared Kubernetes cluster.
Why It Matters
Without limits, a runaway process can spike CPU usage to 100%, starve other pods, trigger autoscalers, and inflate cloud bills. With overly tight limits, the same pod can get throttled and deliver sluggish API responses. A balanced configuration lets teams stretch infrastructure budgets without hurting user experience.
Kubernetes Requests vs. Limits Explained
Kubernetes Requests vs. Limits Explained
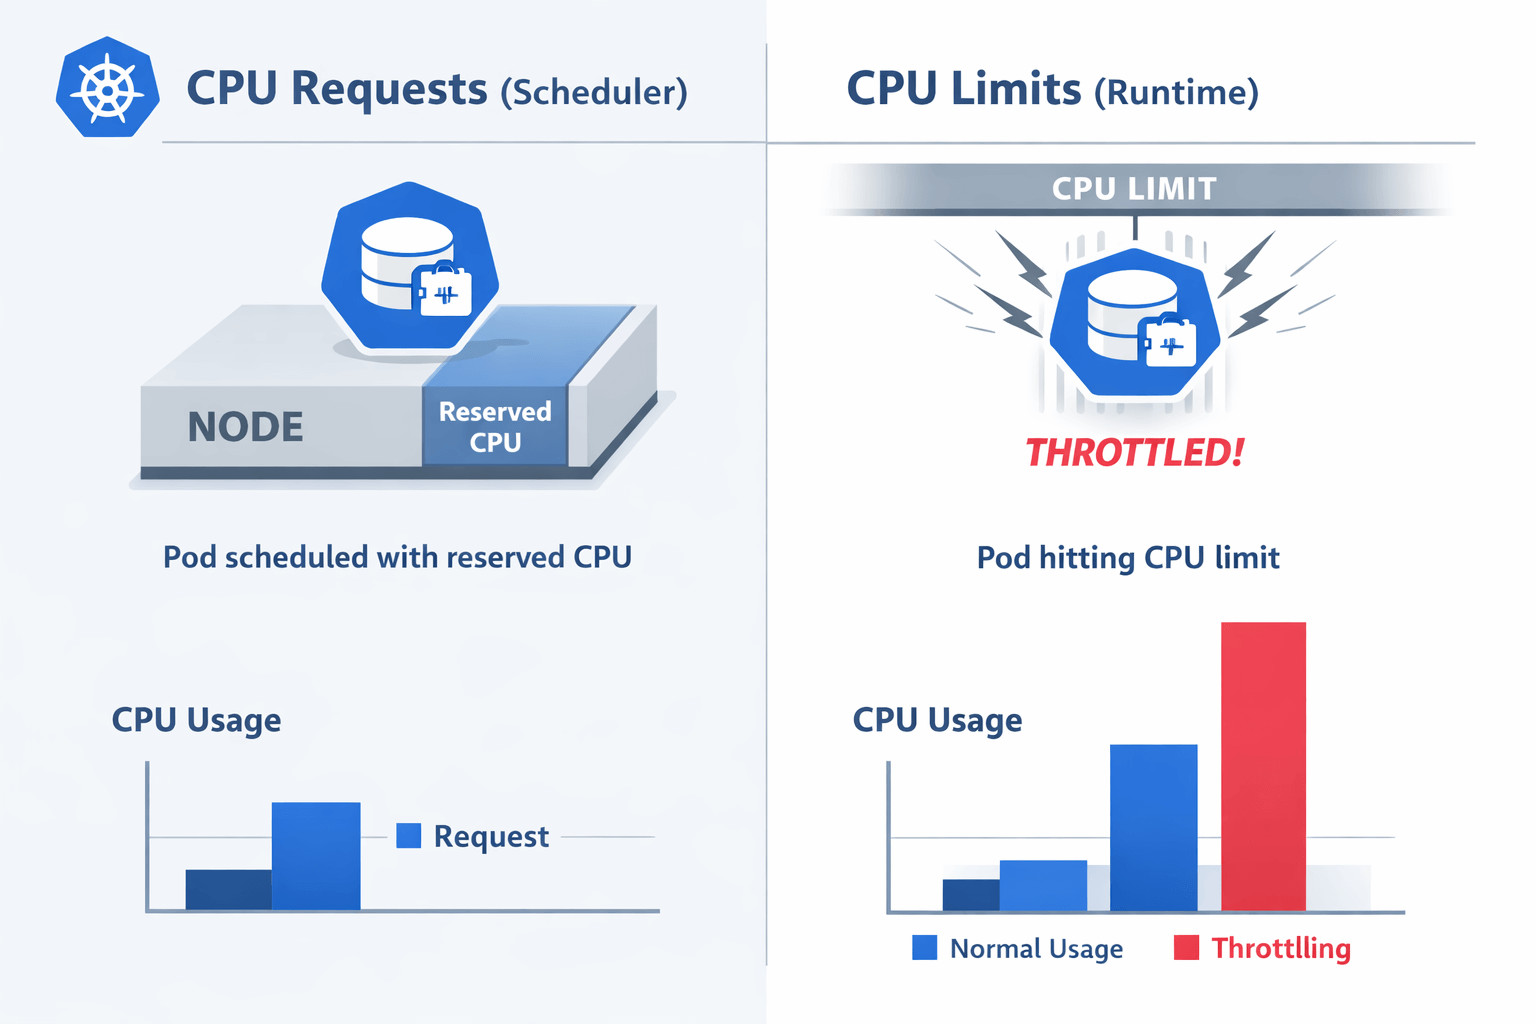
Understanding Kubernetes CPU limits and requests is essential for running predictable workloads at scale. Every pod spec has two fields that work together to affect both scheduling choices and runtime behavior.
- requests.cpu – Scheduler hint. Guarantees that the listed amount of CPU is available on the target node before placement.
- limits.cpu – Runtime ceiling. Caps the amount of CPU the container can consume while running.
If you set only a request, the pod is admitted safely but can still burst beyond its reservation. If you set only a limit, the scheduler may over-commit the node, risking severe throttling and instability during spikes.
Most Kubernetes reference manifests pair the two, often with a limit 1–2× higher than the request, to allow a healthy burst while still bounding worst-case usage.
Common CPU Limit Misconfigurations
Common CPU Limit Misconfigurations
Understanding what can go wrong helps teams avoid expensive incidents:
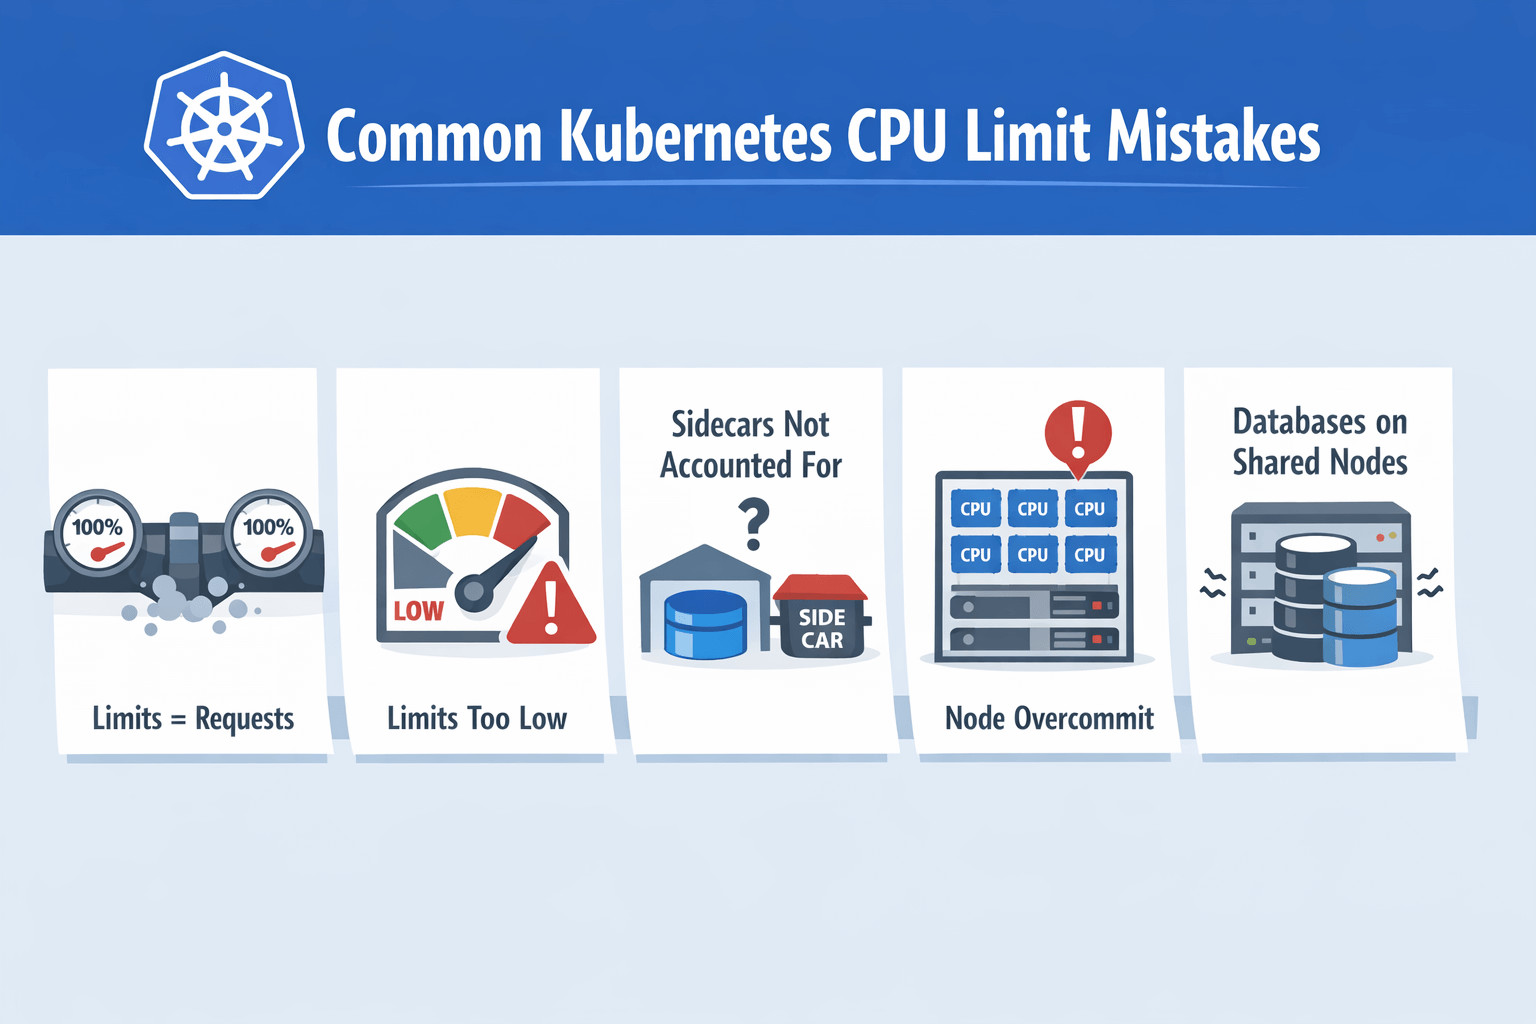
1. Limits = Requests
Copy-pasting identical numbers forces constant throttling during routine load. Databases and JVMs, in particular, experience latency spikes when their threads are paused.
2. Limits < Application Idle Draw
Some runtimes (e.g., Golang with many goroutines) need brief bursts above baseline. Setting a limit lower than that burst causes shaky behavior that is hard to reproduce in dev.
3. Per-Container Limits in a Multicontainer Pod
Forgetting to budget for sidecars like Envoy or collectors can starve the main app.
4. Node Overcommit Without Headroom
Scheduling too many high-request or high-limit pods onto the same small node leaves no CPU for the kubelet and system daemons, leading to heartbeat failures and pod evictions.
5. Databases on Shared Nodes
Kubernetes CPU limits and databases often do not mix well. Stateful engines such as PostgreSQL or MongoDB dislike throttling, and placing them on general-purpose nodes with strict limits frequently results in query stalls, increased tail latency, and replica lag.
Kubernetes CPU Limits Best Practices
Here are a few best practices that many platform and SRE teams follow in production when setting Kubernetes CPU Limits:
1. Profile Real Workloads First
Capture CPU usage with kubectl top, Prometheus, or standard Kubernetes observability dashboards during representative traffic. Note both steady-state and peak. Use p95 as a baseline request; set the limit around p99 or 1.5 × the request.
Tools like Hud.io can complement these metrics by surfacing real production runtime behavior at the code level, helping teams correlate CPU throttling with specific functions, requests, or execution paths.
2. Monitor Throttling Continuously
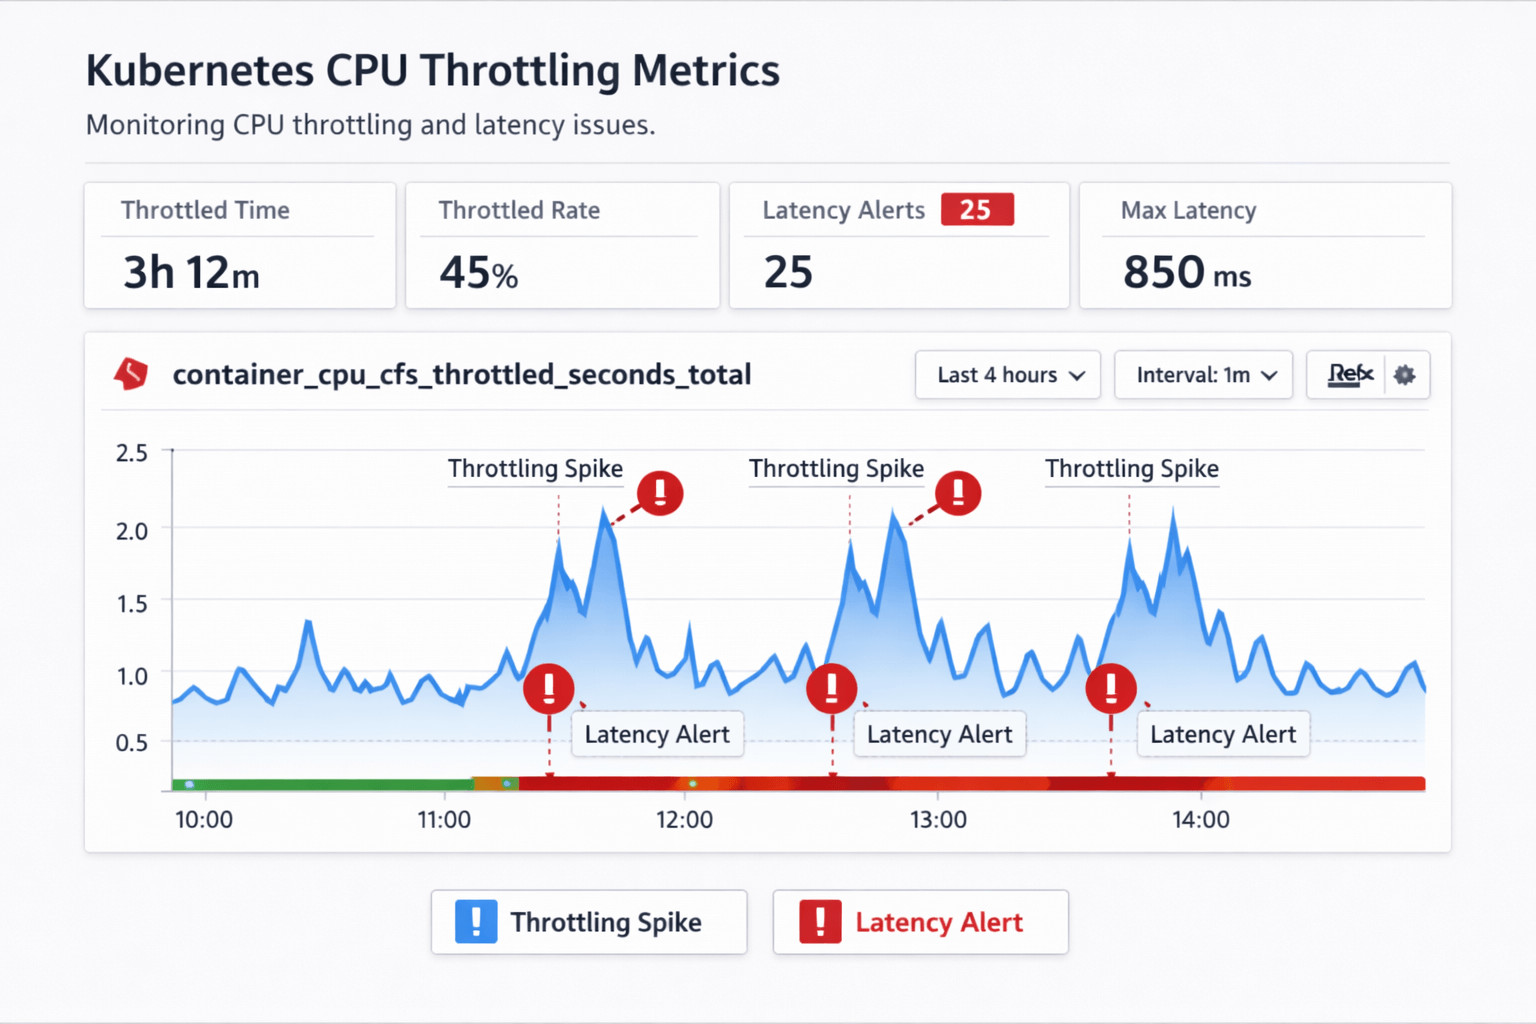
Monitor Throttling Continuously
Export container_cpu_cfs_throttled_seconds_total and its ratio over runtime. Prometheus alerting rules can flag any container that is throttled by more than 2% of wall-time.
3. Treat Databases Differently
If your database is sensitive to latency, you might want to remove limits altogether and instead put them on separate nodes, with requests sized appropriately. This stops CFS from slowing down while still giving the scheduler the information it needs.
4. Use Cluster-Level Overcommit Ratios
In mixed workloads, allow a modest oversubscription (e.g., total requests at ~70 % of node capacity) so that bursty jobs can run without triggering scaling every minute.
5. Document Defaults
Ship sensible defaults in Helm charts or Kustomize bases so that new services inherit a safe starting point.
Following these guidelines lets teams keep latency low, especially for real-time analytics pipelines, while still squeezing more value out of each cloud core.
FAQs
Should CPU limits always be set for containers?
Not in every situation. Apply limits when strict isolation is needed. For example, CI jobs, batch workloads, or multi-tenant clusters where one rogue pod could starve neighbors. For latency-critical, stateful services such as Postgres or Kafka, limits introduce throttling pauses. Give them dedicated nodes and specify only realistic requests instead.
How do CPU limits cause throttling in Kubernetes?
The Linux CFS tracks each cgroup’s CPU time in a 100 ms window. When usage exceeds the quota defined by limits.cpu, the scheduler pauses all threads in that group until the next window, which shows up as throttling metrics.
What happens when CPU requests exceed node capacity?
When a pod’s CPU request would push a node beyond its allocatable cores, the scheduler simply skips that node. If no other node can satisfy the reservation, the pod remains pending. It will launch automatically once you add additional capacity, reschedule pods, or lower the request values.
Are CPU limits recommended for latency-sensitive workloads?
In most cases, no. Workloads that rely on consistently low tail latency, like financial trading engines, OLTP databases, and WebRTC streams, cannot tolerate the micro-stalls caused by CFS throttling. Run them in a dedicated node pool with generous requests, and use priority classes or resource quotas to prevent less-critical pods from crowding them out.
How can teams monitor the impact of CPU limits in production?
Keep an eye on the ratio of cfs_throttled_seconds to total runtime, the p95 latency, and the spikes that occur during throttling. Kubernetes observability dashboards display these metrics, along with pod-level alerts, so teams can respond quickly.
Kubernetes metrics can tell you when throttling happens, but runtime visibility tools like Hud.io help teams see how those limits affect real production code paths and the user experience.