Picture a customer clicking “Pay Now,” and nothing happens. Their screen freezes, they refresh, and the sale is over. You lose more than just money at that moment; you also lose trust. Error monitoring is the safety net that spots these failures the second they spark, funnels the details to your team, and gives you time to fix the bug before users even notice.
What is Error Monitoring?
Error monitoring is the ongoing process of gathering, observing, and analyzing error events in a system. A monitoring tool works with a live application to collect error messages, performance signals, and user reports and turns them into easy-to-read dashboards and alerts. The goal is simple: to see problems as soon as they happen so the team can fix them before users have to deal with them.
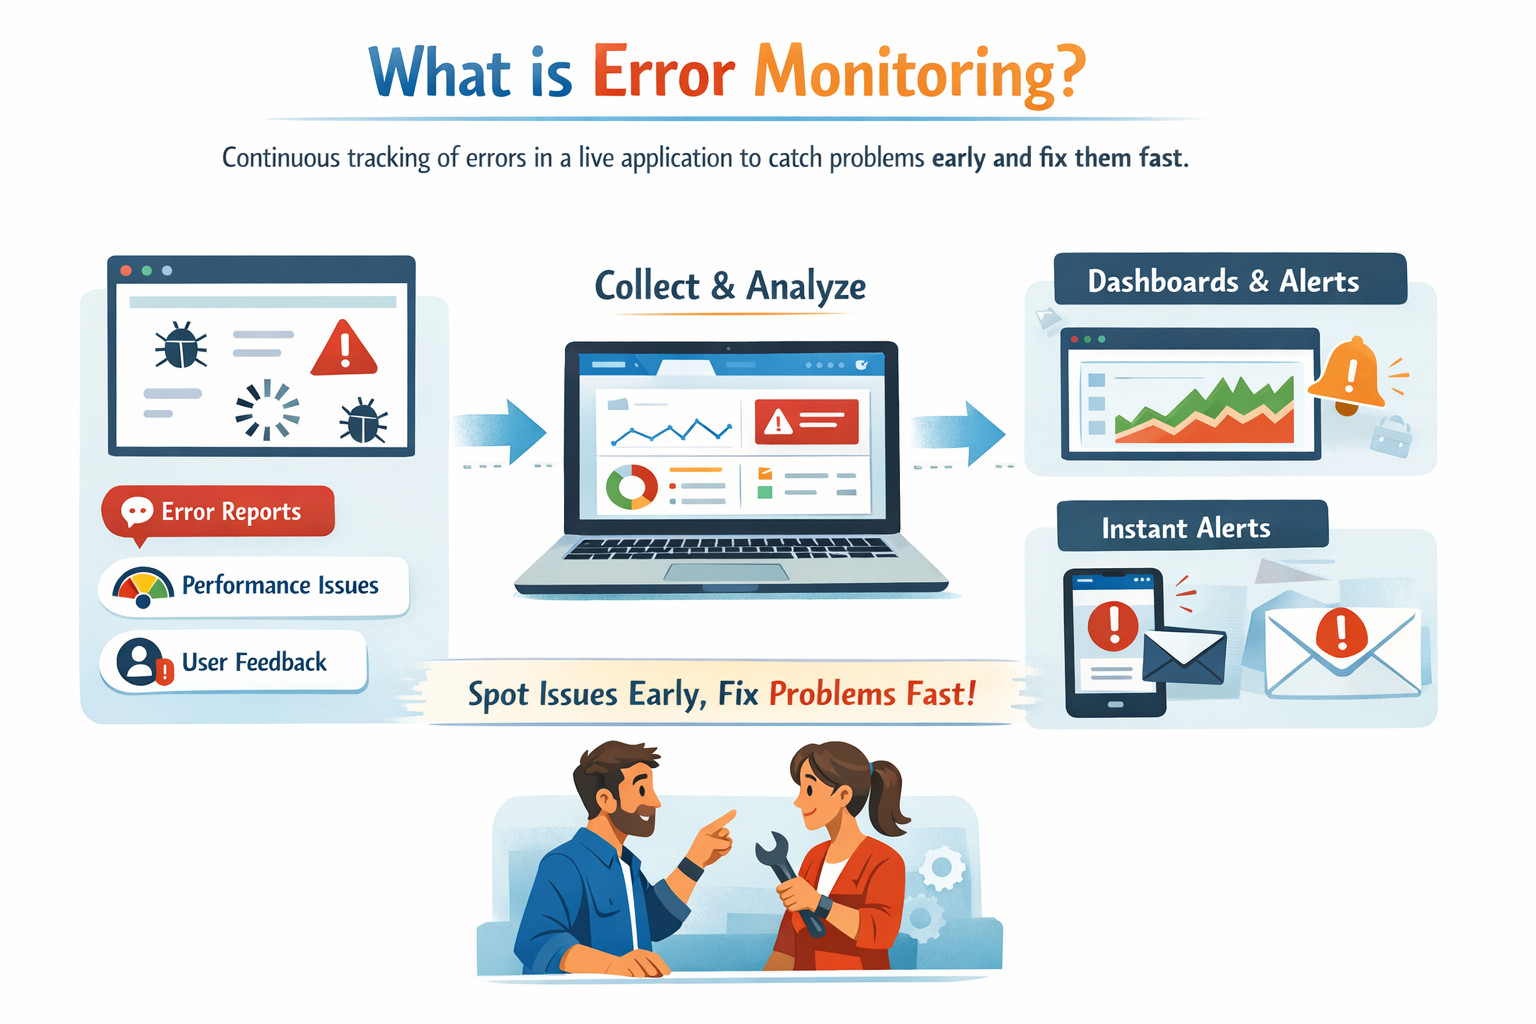
Error-monitoring solutions group similar errors together, add context such as affected users, browser versions, or model versions, and record when the problem started and how often it recurs. This context lets engineers spot patterns, set priorities, and measure the impact of each fix over time.
Error Monitoring vs. Error Tracking
Error tracking
- Follows the life cycle of a single error or bug.
- Records when the error first appeared, which commit or model checkpoint caused it, who is assigned to fix it, and when it was closed.
Error monitoring
- Looks at the wider stream of errors in real time.
- Aggregates data and monitors trends, raising alerts when new or re‑surfacing problems break service‑level goals.
In simple terms, tracking is about the history and ownership of a single bug, while monitoring is about the health of the entire system.
Common Types of Errors Detected by Monitoring Tools
- Runtime exceptions: crashes, null-pointer dereferences, stack overflows, and events that happen when there isn’t enough memory.
- Network failures: time‑outs, dropped connections, bad gateways, and DNS errors.
- Database errors: slow queries, deadlocks, schema mismatches, and connection pool exhaustion.
- Front‑end errors: JavaScript exceptions, failed resource loads, and client‑side performance outliers.
- Security and permission errors: unauthorized access attempts, expired tokens, and cross‑origin request blocks.
- Data quality drifts in AI models: out‑of‑range input features, missing values, and skew between training and production data.
- Hardware and infrastructure faults: disk failures, GPU overheating, and memory leaks in long‑running services.
Benefits of Error Monitoring in AI‑Driven Systems
Detect Production Failures and Behavioral Anomalies
In live AI-driven applications such as LLM-powered services or AI coding workflows, failures are not limited to training errors. Systems can quietly degrade through timeouts, API errors, degraded endpoints, or unexpected outputs (e.g., hallucinations or malformed responses). Effective error monitoring identifies these problems in real time and alerts teams before users do.
Tools like Hud.io provide runtime, function-level data directly from production, revealing errors and performance anomalies with rich context that ties business-impacting symptoms to specific functions.
Reduce User Impact with Faster Incident Detection
Real-time alerts from a monitoring solution let teams respond immediately. This could mean rolling back a bad LLM integration, fixing a guardrail, or slowing down an endpoint that is too busy.
Context-Rich Insight for Root Cause and Guardrail Failures
It’s not enough to know that an error happened; production teams need to know why it happened. Modern tools like Hud.io capture detailed function-level execution patterns, error details, duration trends, and behavioral changes, and make this runtime context available in dashboards, IDEs, or AI coding agents. This depth, including call graphs and error propagation, supports faster root-cause analysis and safer guardrail handling for complex systems.
Prioritized Fixes and Business Outcome Alignment
By looking at how often errors occur, which endpoints they affect, and how they impact users, error monitoring helps teams identify which errors are most important. This lets you set priorities based on what will really happen in the business. For example, looking for repeated LLM hallucinations or high-latency calls that make the customer experience worse instead of just counting mistakes. When you add these signals to the context of live production, monitoring becomes useful and directly linked to the product’s results.
Improved Safety for LLM-Generated and Agent-Assisted Code
AI coding agents and LLMs can write code that looks good but doesn’t work in real life. Hud.io lets both people and agents check code against live runtime behavior by streaming real production telemetry into development tools. Its MCP server enables production-aware AI workflows, with fixes, validations, and guardrail compliance based on real-world usage data.
Conclusion
Error monitoring turns raw error noise into actionable signals. By combining live data capture with smart grouping and timely alerts, it lets teams keep systems healthy, users happy, and development cycles smooth. Whether you run a small app or a global AI platform, consistent monitoring makes every fix faster and every release safer.
FAQs
What is the difference between error monitoring and logging?
Logging saves every chosen event to a file or stream, leaving it up to humans to read and interpret. Error monitoring adds automation: it filters logs, groups related events, attaches context such as user IDs and model versions, and sends alerts when the rate exceeds a safe threshold.
How does error monitoring help reduce downtime?
Monitoring works in real time. When an error spike occurs, the tool immediately notifies the on‑call engineer. Rapid awareness means a quicker rollback, feature flag off, or hot fix, so the faulty code spends less time in production and users see fewer failures. Shorter response time equals shorter downtime.
Can error monitoring tools track errors in production environments?
Yes. Today’s monitoring agents sit inside your running code and devices with almost no slowdown. They stream only the necessary error details, such as stack traces, request IDs, or model versions, while skipping noise and sensitive data. Dashboards update in seconds, so engineers can study live failures without taking the system offline.
How does error monitoring support faster debugging?
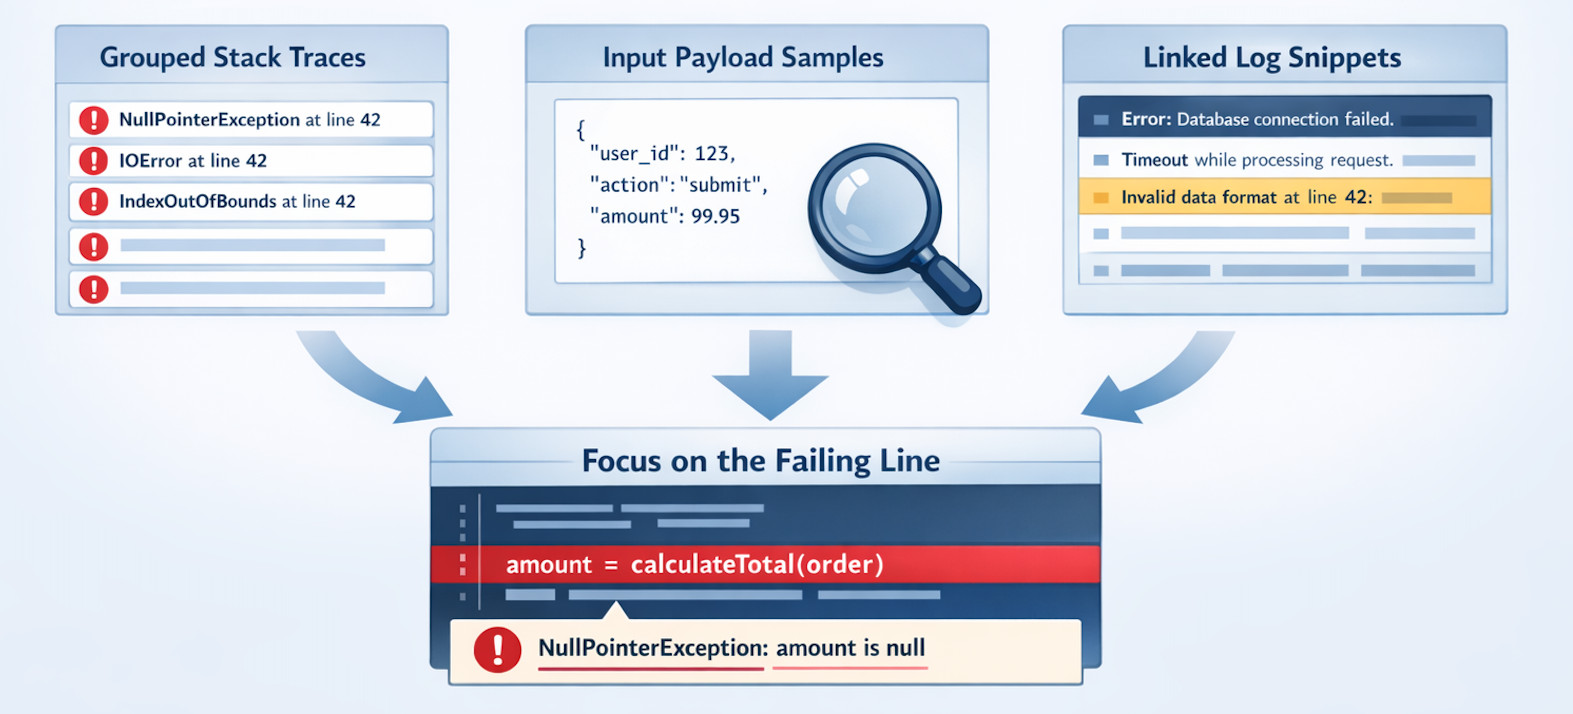
When a crash happens, the monitoring platform shows the exact line, variable values, user actions, and system metrics that caused it. Grouping prevents duplicate tickets and highlights the first appearance. Engineers jump straight to the suspect commit or model weight, saving hours of manual log digging.
Is error monitoring useful for AI and machine learning systems?
Absolutely. AI pipelines have unique failure modes, such as data drift, exploding gradients, and concept drift. Monitoring tools that understand metrics such as model loss, confidence distribution, and input schema shifts can alert when predictions become unreliable. This keeps automated decisions safe and guides retraining schedules.