Microservices split work across many moving parts. One user request can pass through an API gateway, multiple services, a database, a cache, a queue, and an external API. When latency spikes or errors rise, a single service log rarely tells the full story.
Distributed tracing fixes this by treating each request as a single story, even when many services are involved. A trace view shows where the request went, when it occurred, and where failure started, without having to guess based on timestamps across separate log streams. Vendors describe Distributed Tracing as tracking requests as they move inside distributed cloud environments with a shared identifier.
What Is Distributed Tracing?
Distributed Tracing records request flow across service boundaries. A trace starts at the entry point, such as an edge proxy or API gateway. The entry point assigns a trace identifier. Downstream calls carry tracing context; therefore, other services join the same trace.
Each service record spans a specific period. A span indicates one unit of work with start time, duration, and metadata. A trace is a sequence of spans linked under a single trace ID.
Think in terms of what you see during an incident. You open a trace for a slow checkout request. The timeline shows a fast API handler, a long database query, and a retrying call to a payment provider. Instead of searching distributed logging for matching request IDs and aligning timestamps, you read one timeline.
Span naming and attributes decide whether traces help under pressure. Generic span names like “GET” or “SQL” waste time. Clear names like “CartService GetCartByUser” or “Inventory ReserveItems” make the investigation faster. Attributes such as route, status code, error type, dependency name, and tenant provide filters for trace search.
Distributed Tracing vs Logging vs. Metrics
Logs, metrics, and traces serve different questions. Mixing them without a clear role leads to noise.
Distributed logging
Logs record events inside a service. Logs show error messages, input values, branch decisions, and business events. Distributed logging centralizes logs from many services, so your team searches a single place. Distributed logging still requires correlation, however. Engineers often filter by request ID, then jump between services to rebuild the full path.
Metrics
Metrics show trends over time. Metrics answer questions like “How many requests failed?” and “When did latency rise?” Metrics work well for alerting and impact checks. A p95 spike or error rate jump gives a fast signal that something changed. Metrics rarely explain which hop caused the problem for one specific request.
Distributed Tracing
Distributed Tracing connects a single request end-to-end. Metrics show symptom and scope. Logs show details inside one service. Tracing shows the path and timing across services, plus the dependency chain. A trace view helps answer questions during debugging production issues:
- Which service added the most latency for this request?
- Which downstream dependency slowed down?
- Where did the first error appear?
- Did retries or timeouts amplify latency?
A common workflow looks like this: Metrics trigger the alert. Distributed Tracing points to the slow span or failing dependency. Distributed logging provides the exact error and input context for a fix.
OpenTelemetry also highlights correlation across signals through context propagation, tying traces, logs, and metrics to the same request context.
Common Distributed Tracing Tools and Standards
Most teams pick two layers: instrumentation and backend.
Instrumentation
OpenTelemetry is the go-to standard. It offers APIs and SDKs across languages, plus collectors and exporters. Its documentation describes context propagation as the mechanism that allows traces to maintain causal links across processes and network boundaries.
Standards matter for propagation. W3C Trace Context defines standard HTTP headers for passing trace context between services. The specification describes traceparent and tracestate as the primary headers for portable context, plus vendor-specific context.
Backends and Distributed Tracing tools
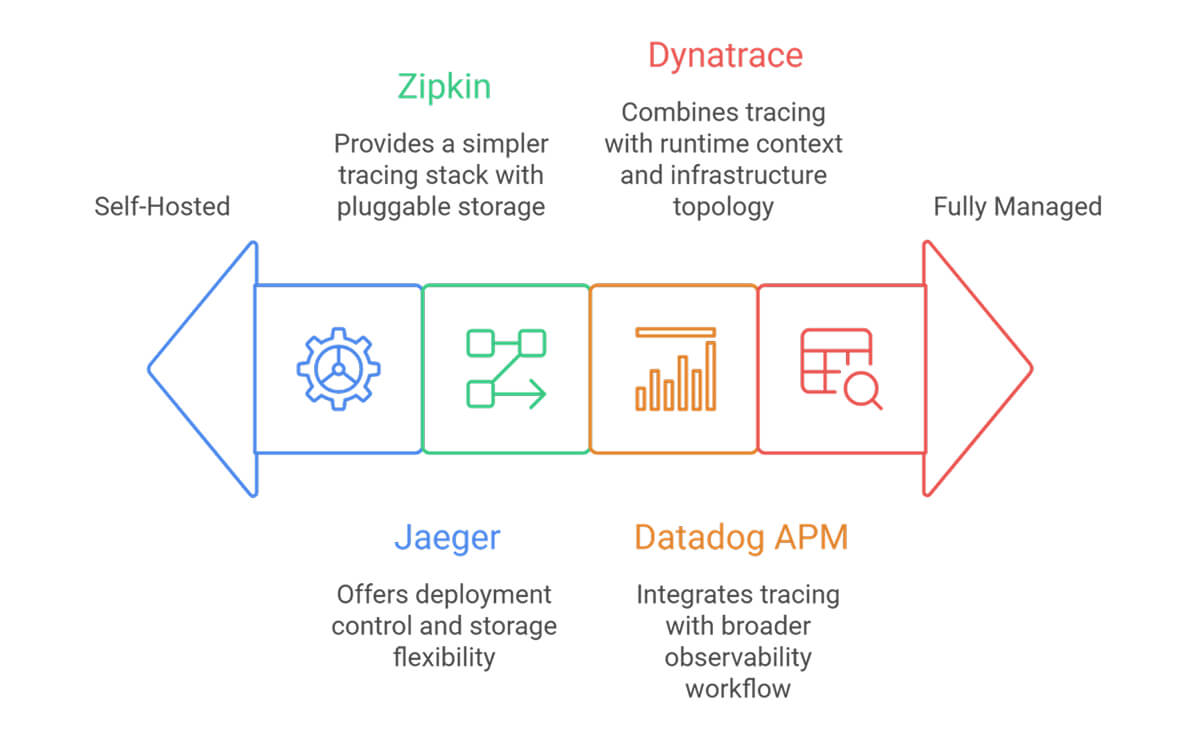
Open-source options include Jaeger and Zipkin. Both store and visualize traces and support search and dependency views.
Commercial platforms include Datadog and Dynatrace. Datadog describes trace ingestion via vendor libraries or OpenTelemetry, plus real-time search and retention controls, including tail-based decisions to keep error and high-latency traces while managing costs.
Tool choice depends on constraints in your stack. Self-managed backends fit teams that want control. Managed platforms suit teams that want faster rollout and fewer internal ops tasks. Across both paths, the same basics matter: consistent propagation, useful span names, and sampling rules that keep cost predictable.
FAQ
How does distributed tracing work in microservices?
A request enters through an edge component, such as a gateway. The gateway assigns a trace ID and passes trace context to downstream services through headers or message metadata. Each service record spans local work and outbound calls. A backend group spans by trace ID and reconstructs the full request timeline.
What are spans and traces in distributed tracing?
A trace represents a single request across multiple services. A span represents a single operation within the request flow, such as a database query or an internal API call. Each span records timing and context, such as status and attributes. Spans link through parent-child relationships, so a trace view shows ordering and dependency paths.
How does distributed tracing help with debugging production issues?
Distributed Tracing shows a single request path and timing across all involved services. Your team sees the slowest span, the dependency chain around it, and the first failing call. This view reduces manual correlation work across distributed logging streams and speeds root-cause isolation during incidents.