
Omer Grinboim
Mar 23, 2026

In the constant run for the newest technologies, best optimizations, and reduced stress on the team, all thanks to a rigid architecture that does not flinch easily, errors and bugs will still find their way inside. At times when production outages need to be understood and solved rapidly, profilers will give you the magnifying glass over your stack, and debuggers will give you the tools needed to fix what is broken.
Digging into these principles, we will uncover 12 technologies, each aimed at a different purpose, that, together, offer an end-to-end overview of the process of discovering a root cause and applying a patch in the most efficient way. As each team brings its own tech stack and experience, each tool will be useful for a specific area. We will explore all of these tools and analyze the appropriate time to use each one.
Profiling is the process of analyzing your system in order to understand its performance, resource usage, and behavior. It guides the discovery of bottlenecks and the development of optimization strategies. From metrics to logs and back to monitoring dashboards, we will explore how we can zoom into our digital realms and where each tool fits and serves its purpose.
Debugging is the process of getting to the bottom of an investigation by making systems tell you the information you need. Bugs may be obvious or more hidden to the human eye, so specific tools were created to make it easier and more efficient to find the patches we are looking for. Given that it is either (1) a breakpoint that will allow you to dissect the existing variables and understand the flow of value changing up to the point where you find the issue, or (2) an aftermath of a runtime where we can see memory spills, debugging is a crucial element when it comes to getting production deployment back online and business going.
Every hour you spend guessing in production is an hour of revenue loss. When every minute matters, it is important to use a strategy that will bring you closer to the resolution in educated steps. Using profilers to reduce the scope of investigation to the relevant parts and using the right debugger for the problematic areas will grant the smart step-by-step moves that lead to a green health check (and a good night’s sleep).
What is more important than the qualities of the tool itself is the scope narrowing that will make the approach decisions easier. After using profilers to achieve this, the right debugger tools are those that focus specifically on that isolated area of the system. Once we have narrowed our spectrum of possibilities, an effective debugging tool will highlight the problematic code.
Let’s explore how we find it:
Fit your stack: Whatever technique you approach, it must be compatible with the systems you have at hand. You should not even try to analyze a C program memory loss using a Python debugger.
Observability depth: Logs will bind multiple behaviours into the same resolution, which might not always be the right one for the current problem. The reason why metrics and traces are combined with the logs is to build the bigger picture.
Team knowledge: If your team is already using Prometheus/Grafana, using Datadog dashboards is an overhead that not only is not needed, but will actually make the process slower, the learning curve steep for no good reason, and will not benefit the current mission to get to the bottom of the problem as soon as possible.
Integration & IaC: Use automated dashboards for input-defined events. Every service in proper projects should ship with observability enabled by default.
Runtime safety: Production debugging tools need to have fast flows, an intuitive user experience, and promote the continuity of business activities.
Support & ecosystem: At 2 AM, good docs and an active community are what will make the difference.

Hud
Hud detects errors and performance degradations in production with the deep forensic context needed to fix them, making it the best AI debugging tool.
Hud gathers errors and performance data at the service and function levels. At runtime, it connects the business impact and the root cause in the code. Engineers can use this data live in the IDE to understand how their code behaves in reality.
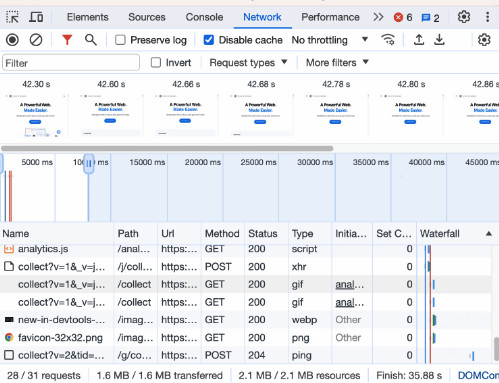
Chrome DevTools
Chrome DevTools is included with the Chrome Browser and is the most convenient debugging tool for web developers. With it (Right-click > Inspect), you can explore the DOM, CSS, and JavaScript and make changes to see how they affect the user experience.
Chrome DevTools also provides metrics on the browser behavior (Performance Tab), downloads (Network Tab), and rendering.
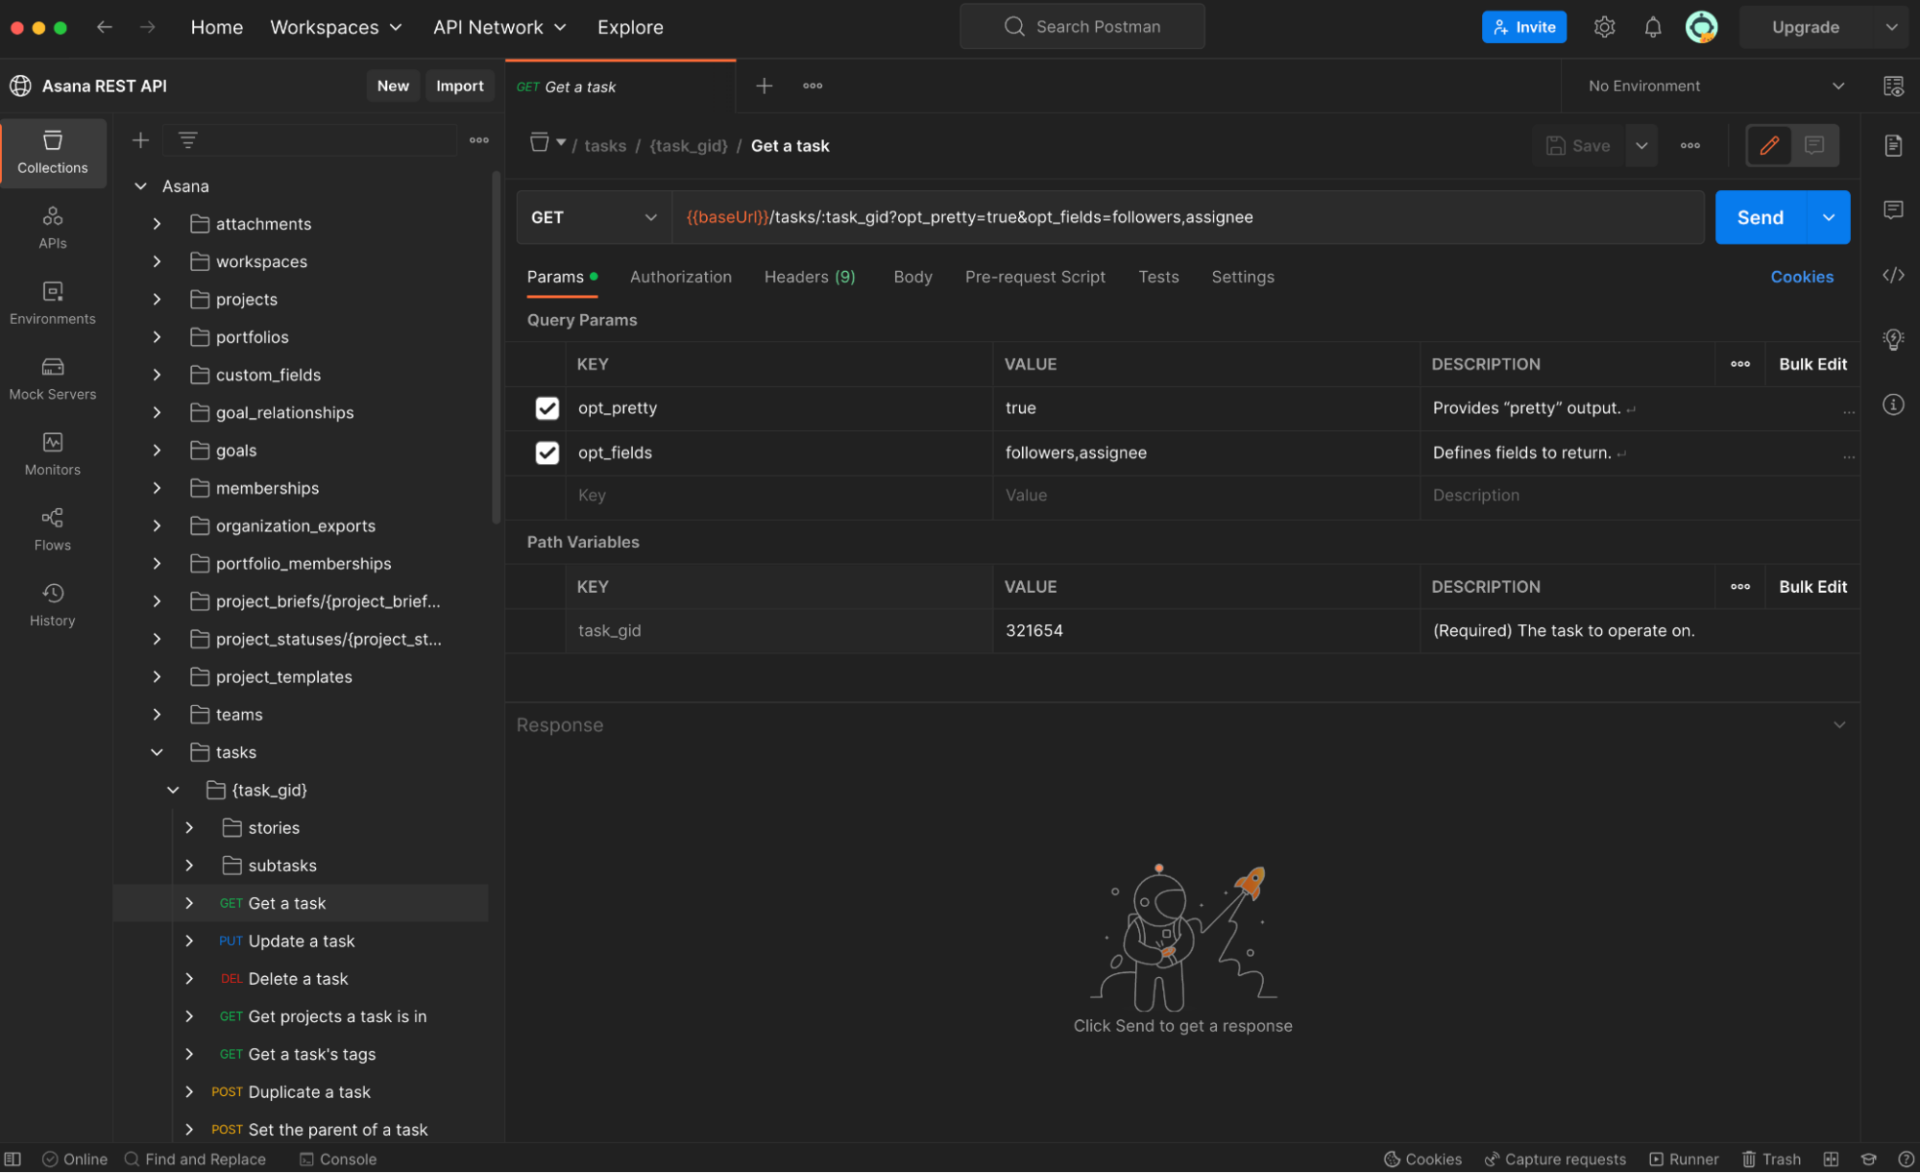
Postman
Postman shines as one of the best debugging tools for API testing, debugging request flows, and maintaining centralized testing repositories. It empowers developers and QA teams to test APIs efficiently, debug request and response flows, and maintain organized collections of API tests.
By combining Postman Environments with Collections and the Newman CLI. Teams can write tests once and run them from local to CI/CD and back to the cloud. This approach eliminates the complexity of manually written curl commands while maintaining test consistency across environments. A repository of Postman collections and environments, made granularly per project, is the best way to keep your tests organized, maintained, and centralized for convenience and reusability.
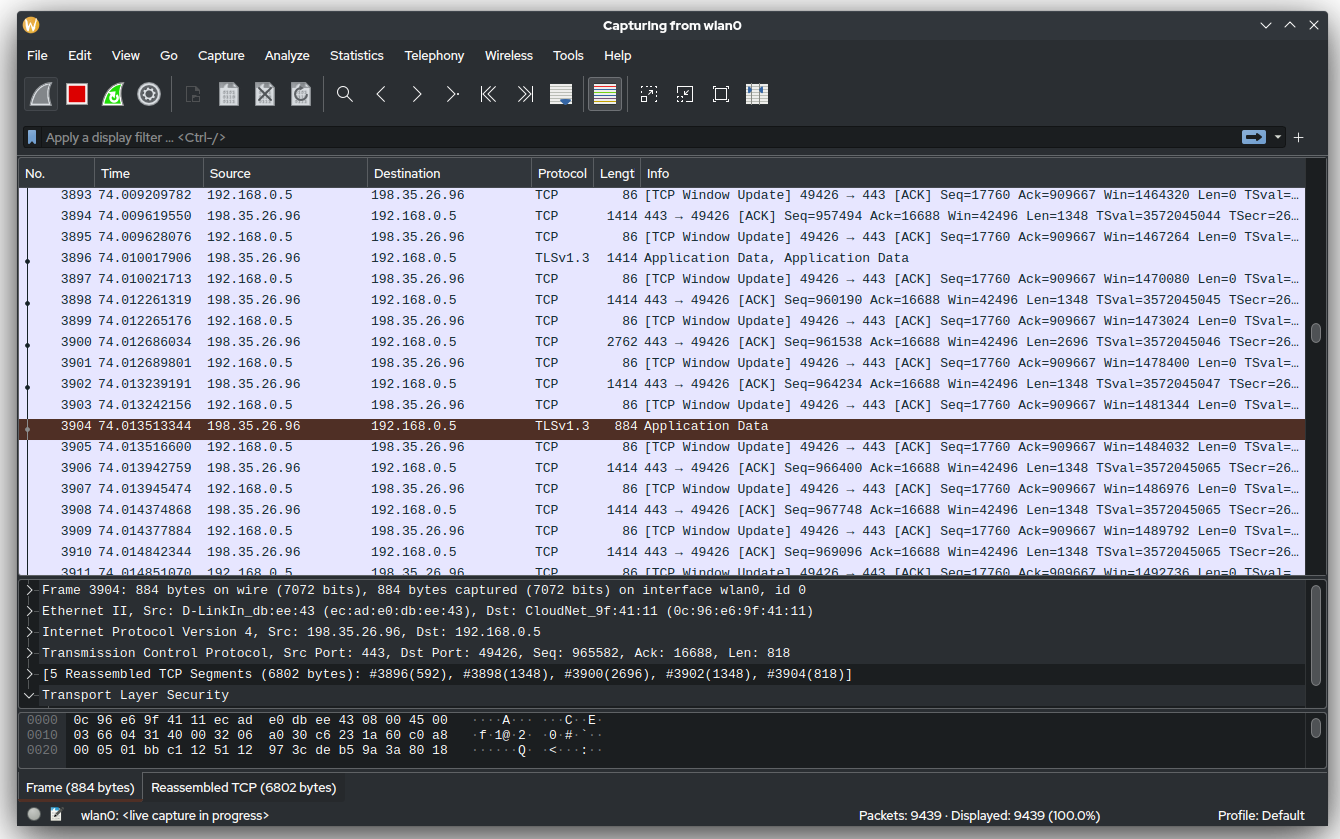
Wireshark
When we talk about network traffic, we are referring to Wireshark. It intercepts packets sent over the network and allows you to digest them into fingerprints of intruders or faulty code. Used by penetration testers worldwide, it provides a comprehensive package for ensuring your network’s integrity and reliability.
GDB is an open-source debugger that supports programming languages like C and C++. It offers developers a command-line interface for executing debugging tasks.
With GDB, users can poke into internal program variables and functions, and invoke code steps in a controlled manner to analyze changes line by line, loop by loop, and issue by issue.
Valgrind is your memory hero. If C/C++ are your drivers, Valgrind will signal when your memory crosses a red light. Leaks are common in C programs and often go unnoticed until your instance suddenly runs out of memory, when you discover that you forgot to free up an array that ended up eating your resources in production. Valgrind monitors all memory operations and reports any memory that is allocated but not properly deallocated.
PDB, the Python Debugger, is one of the most well-known solutions for data pipelines and backend Python development. It is built into Python and provides a debugging environment that allows developers to set breakpoints, step through code, and inspect values stored in variables.
The One Command: breakpoint()
Prometheus stands out in cloud-native metrics, performance debugging tools at scale, and Kubernetes monitoring. It is an open-source system-monitoring and alerting toolkit that collects metrics from configured targets at specified intervals, evaluates rule expressions, displays results, and can trigger alerts.
Prometheus is pull-based. Your apps expose a /metrics endpoint, and Prometheus collects the metrics from there.
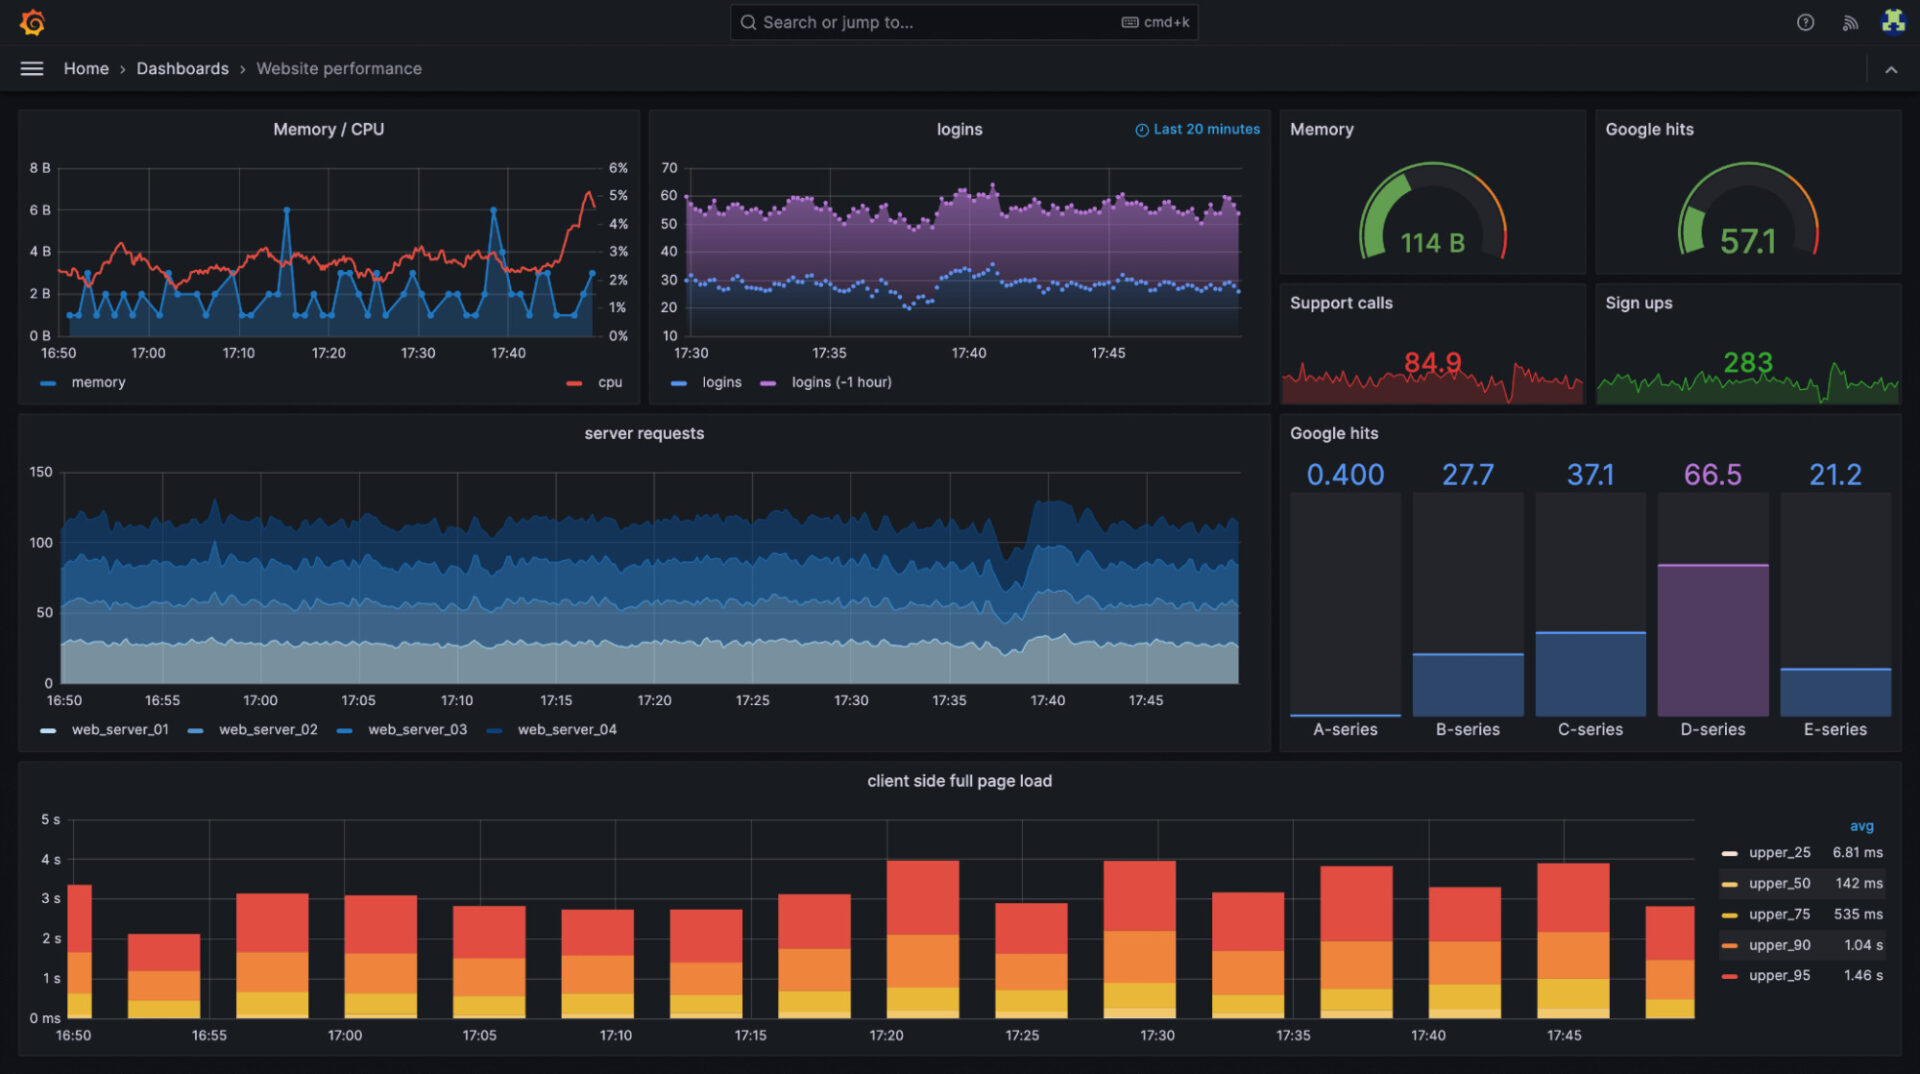
Grafana
Grafana is the standard choice for centralizing the visualization of metrics, traces, and logs from multiple sources. It is an open-source analytics and visualization web application that allows users to set up charts, graphs, and alerts based on data sources.
Set up annotations that automatically mark deployments. When something breaks, you see exactly which release caused it. It is multi-source (Prometheus, CloudWatch, Datadog), with alerts and a fast “Explore” mode.
The ELK Stack (Elasticsearch, Logstash, and Kibana) centralizes logging, full-text search, and debugging tools for log correlation. It provides a complete solution for collecting, processing, storing, and visualizing log data from multiple sources.
When your logs are scattered across 50 servers, the ELK Stack consolidates them into a centralized, searchable space.
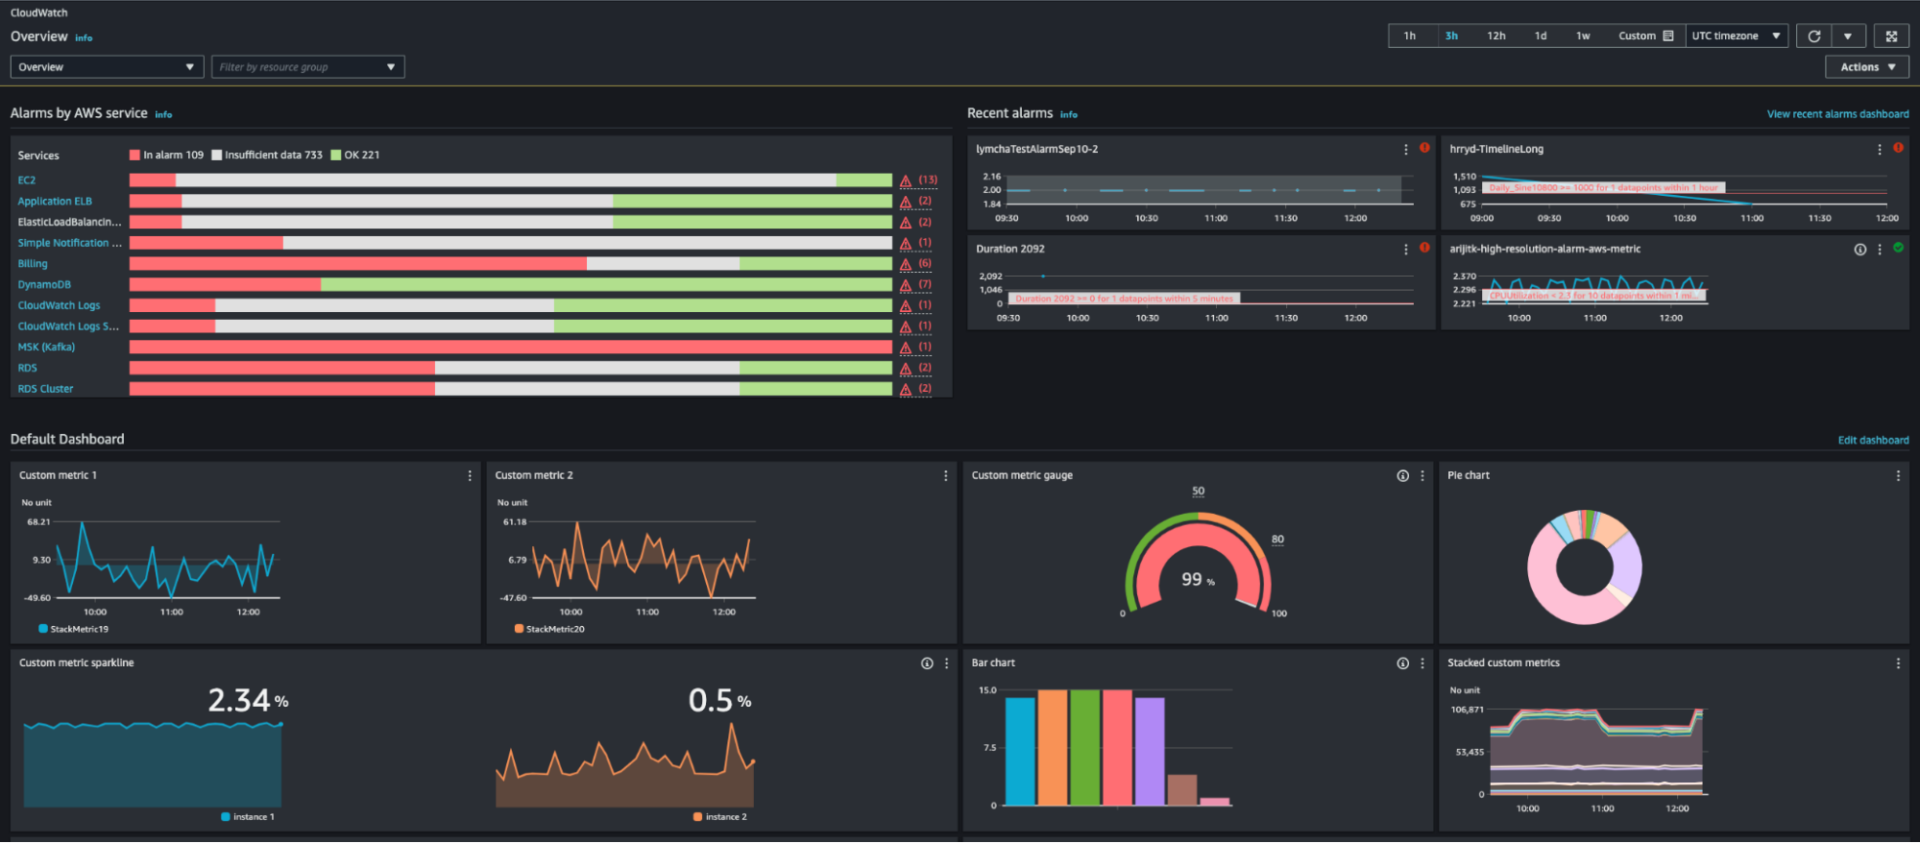
Amazon CloudWatch
Amazon CloudWatch is your powerhouse for AWS metrics/logs, IaC dashboards, and live tail regex highlighting. It is a monitoring and observability service built for AWS cloud applications and the hybrid cloud, providing data and insights to monitor applications, respond to changes in system performance, and optimize resource utilization.
Built-in, inexpensive, and SQL-like, it logs insights and provides anomaly detection and a live tail for real-time pattern spotting. Cloudwatch dashboards can also be deployed with Terraform. When creating a new service, you just deploy with Terraform and the corresponding tfvars for that service. Alerts are in place in an instant.
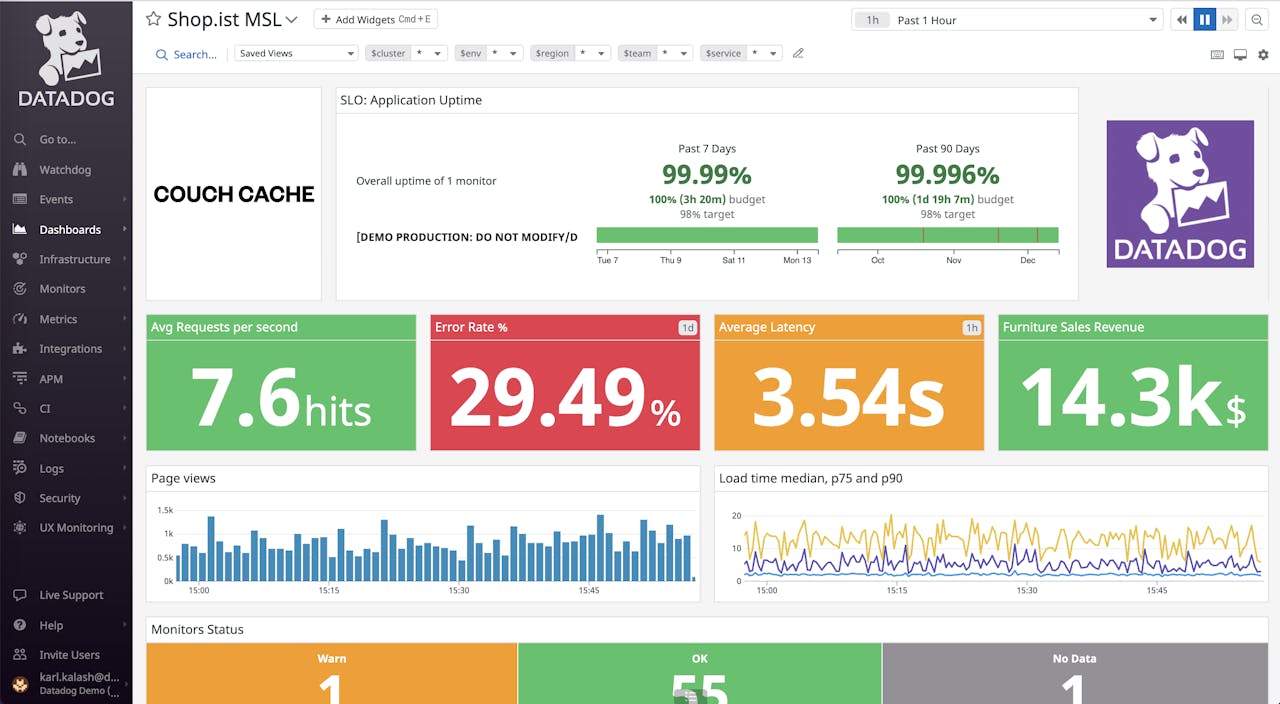
Datadog
Datadog is the complete package for full-stack observability (APM, infra, logs, RUM) and serverless tracing. It is a monitoring and analytics platform for cloud-scale applications, providing insights into servers, databases, tools, and services.
Datadog is strongly used at enterprise scale, processing petabytes of data daily. The platform offers plug-and-play integrations with AWS, Kubernetes, databases, message queues, and other infrastructure components. With APM, infrastructure monitoring, logs, and RUM, it provides a centralized interface for all your . Native AWS Lambda integration only requires adding the layer to enable automatic trace collection. Terraform integration enables infrastructure-as-code practices for observability configuration and automation.
What’s the difference between debuggers and profilers?
Debuggers let you pause code and investigate. You can check variables, step through lines of code, and figure out why something isn’t working properly. Example: PDB catching Email vs. email case sensitivity. Profilers measure speed and resource usage. They tell you what’s problematic, not what’s wrong. Example: Chrome DevTools Performance tab showing hottest functions. Use a debugger when it’s wrong; use a profiler when it’s problematic.
What is the best debugging tool for production in 2026?
The best debugging tool for 2026 is one that works in production, connects errors to real business impact, and helps engineers fix issues without slowing the system down.
Hud is purpose-built for this exact need: it detects production errors and performance regressions, enriches them with deep runtime context, and brings that insight directly into the IDE – where fixes actually happen.
Most teams still complement Hud with stack-specific tools (like browser debuggers, API testers, or metrics platforms), but Hud is the system of record when it comes to understanding why production issues happen and how to fix them safely.
How do I choose the right tool?
Align with app type (browser, API, serverless, on-prem), team experience (PromQL/Kibana/Slack), and budget/credits (AWS-native vs. Datadog).
Example:
The most effective tools will match your stack, team skills, and budget.


