
Mar 27, 2026
Listen, I’ve lived through the kind of production disasters that give you gray hair. The ones that hurt the most didn’t even set off a single alert. No red boxes flashing on the wall. No PagerDuty screaming. Just a quiet Slack message at 2:00 PM: “Hey, is checkout working for you?”
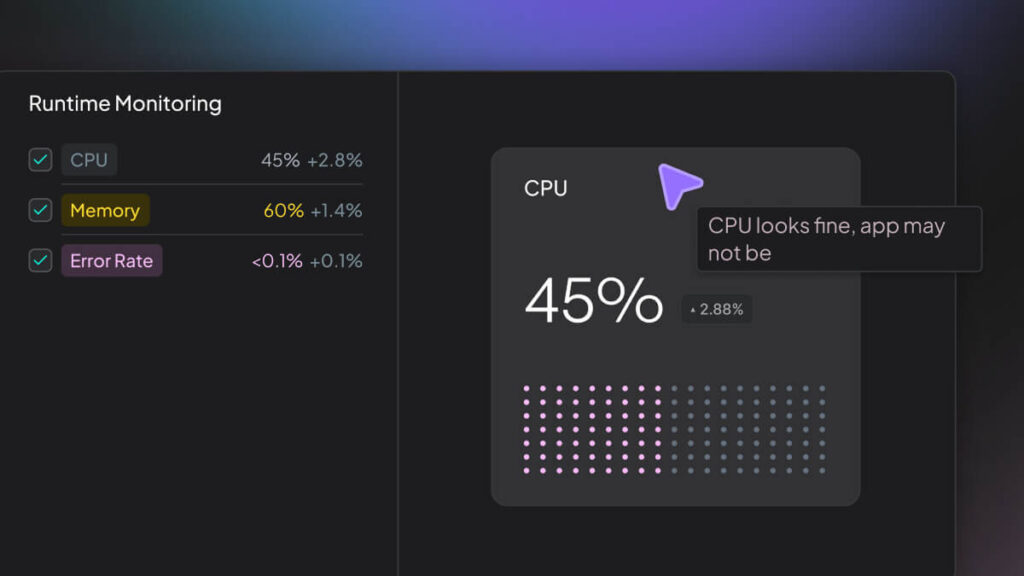
I jumped into the dashboards, and honestly, I thought I was losing it. The CPU was at a flat 45%. The memory was boring 60%. Error rates were negligible, barely 0.1%. Everything looked “perfect” on paper. But for the people trying to buy stuff, the app was a total brick. Total silence.
This is the big lie in modern monitoring. We’ve gotten really good at watching the “box.” We stare at servers, pods, and VPCs as if it were still 2010. But we are staying pathologically blind to what the code is actually doing while it runs. This gap between “it is up” and “it is actually working” is a massive canyon. Checking CPU usage won’t help when the internal logic has already locked itself in a cupboard. You need real runtime monitoring.
Look, the “Golden Signals” like latency and traffic? Those are just the floor, external fluff. They tell you the flight landed late. They won’t tell you the engine was running hot for the last hour. Same deal with your app – is a request slow because of some stupid DB lock or because the garbage collector just decided to trigger a “stop-the-world” event that pinned every single thread?
If you want to stop getting punched in the face by “ghost incidents,” you have to measure the execution path. Not the container. The actual code. This is a shift from just watching boxes to real runtime monitoring.
First rule: averages are trash. They are a total trap. I’ve seen teams high-fiving over a p50 latency of 40ms while their p99 was swinging like a lunatic between 3 and 12 seconds. That means 1% of your users are basically in hell while you celebrate your “green” charts. If you aren’t obsessing over the tail, specifically the p95 or the p999, you aren’t seeing the real world. One slow downstream dependency can spiral into head-of-line blocking, choking your whole stack before you can even refresh the page.
But latency is just the scoreboard. Here is what I actually track when the dash tells me things are fine.
1. Garbage Collection (GC) Stall Times
If you’re on a JVM, Go, or whatever, GC is your landlord. Usually, it’s quiet. But when heap pressure gets weird, it gets mean. A 300ms pause won’t hit a CPU alert. But it will instantly tank your p99. You need to watch the allocation rate versus the reclamation rate. If those “major” collections are happening every few seconds, your app is in a death spiral long before the OOM killer shows up to put it out of its misery.
2. Thread Pool Saturation & Queue Depth
Most backends live or die by thread pools. Hit 90% saturation, and you’re one tiny spike away from a total lockup. But the real kicker is when your threads are idle while your internal queue grows. That means you’ve got a bottleneck in the executor itself. Maybe a lock. Maybe a slow I/O block. Your CPU looks “healthy,” but your capacity is zero. Monitor the queue-it’s the loudest signal you have, period.
3. Connection Pool Exhaustion
Pools for DBs or external APIs are finite. Period. When they are full, requests just park. This creates a creeping, mysterious slowness that won’t show up in your logs. It just feels heavy. You need to know how many threads are currently sitting there waiting for a connection. If that number isn’t zero during normal Ops, you are living on borrowed time.
4. Error Type Deltas (not Just Rates)
A 1% error rate is just noise. But what is the delta? If yesterday’s 1% was a 404 and today’s is a SocketTimeoutException, you’ve got a massive fire masked by a “normal” aggregate number. Aggregates are for managers. Deltas by exception type are for engineers.
Get these metrics into your runtime monitoring stack. Otherwise, you are just flying blind with a nice-looking compass.
Setting alerts at “CPU > 80%” is a total rookie move. It leads to the kind of alert fatigue that makes SREs want to quit and open a coffee shop.
Systems aren’t some static thing. Your app at 10 AM on a Monday is a different beast than at 3 AM on Sunday. A threshold that is “safe” for Sunday will scream all through Monday morning. So you mute it. And then you miss the real crash on Thursday.
This is where runtime observability actually does something. We shouldn’t be hunting for some magic number. We should be hunting for “weirdness.” Establish a behavioral baseline-a map of what “good” looks like for your specific code under current pressure.
For example, if your service usually allocates 400MB of heap per minute and suddenly allocates 3GB, that is an anomaly. It doesn’t matter if you have 32GB of RAM and aren’t near the container limit. That sudden delta in “allocation churn” tells you something in the code path changed. A leaky feature flag? An inefficient loop? The baseline tells you something is wrong before the user has to send that DM.
Doing this is hard. You need historical context. Traffic seasonality. But once you have that “normal” profile, your alerts become high-signal. You aren’t alerted because “it is high.” You are alerted because “it is acting weird for a Tuesday.” That is the goal.
Look, behavioral monitoring is a lot of work. You need tools that can actually learn the rhythm of your code. But the payoff is catching the “silent killers” before they turn into full-blown outages.
Kubernetes and the microservice explosion made tracking “behavior” way harder. In the VM days, you knew your servers by name. Now? Pods are ephemeral. They pop up, grab some traffic, and get reaped in twenty minutes.
When your infrastructure is basically “cattle,” your static monitors are worse than useless. You need production runtime metrics that actually understand containers and the orchestration layer.
The “Noisy Neighbor” problem is the bane of my life in K8s. One pod on a node starts thrashing the cache or pinning the CPU, and every other pod on that node suffers as a result. Node-level alerts tell you the node is hot, but which pod is the arsonist? You need container-level, runtime-aware tools to isolate the resource hogs.
And it is not just about the container. You have to see service-to-service correlations. This is where Hud fits in. By giving you function-level observability and real runtime intelligence, it lets you see which specific code paths are burning cycles in production without you having to sprinkle print statements or “span tags” everywhere. When you roll out a new service, you shouldn’t just be checking “Is it 200 OK?” You should be comparing its “behavioral fingerprint” to the build before it.
In the cloud, “healthy” is always a relative term. If twenty pods are identical, and nineteen have a p99 of 80ms while one has 350ms, that pod is broken. Period. Finding that outlier is the whole point of modern runtime analysis.
I will never forget this one. We had a slow report of “glitches” in the search API. I checked the dashboards. Everything was green. P99s were fine. Error rates were flat.
We spent four hours chasing our tails. It turned out that one single instance of the search service had a weird connection pool leak, causing high retry counts. But because we were looking at “Service-Level” aggregates, that one sick instance was being smoothed out by the hundreds of healthy ones. 10% of users were having a total nightmare, but the dashboard said we were fine.
The dashboard was a decoy.
This changed how I think about monitoring. Aggregate metrics are where truth goes to die. To find it, you need runtime performance monitoring that lets you slice and dice by instance, by pod, by version. You have to look at the “long tail” of the distribution.
When you conduct an application runtime analysis, look for the variance. High variance is the smell of a system that is about to break. It means competing for resources. Locks. Throttling. GC pressure. If your performance spread is wide, you aren’t “stable”-you’re just lucky.
Don’t trust the green lights. If the users are complaining, the dashboard is wrong. Dashboards are just models, and all models are wrong sometimes. True resilience happens when you peek under the hood and measure what matters when everything looks totally normal on the surface.
What is runtime monitoring?
It is like peeking inside the engine while the car is doing 80mph. Instead of just checking if the engine is “on,” you’re looking at fuel injection timing, oil pressure, and vibration. It gives you the “why” that infrastructure monitors totally ignore.
How is runtime monitoring different from infrastructure monitoring?
Infrastructure monitoring watches the “room.” It looks at the CPU, disk, and network. Runtime monitoring watches the “person in the room,” which is your actual code logic. A server can look perfect while the app inside is totally locked up waiting on a database. Runtime picks up where the “box” monitoring ends.
What metrics should be tracked during normal system behavior?
Stop looking at p50s. Watch the p99s, the GC pause frequencies, and the depth of your internal request queues. These are your leading indicators. If your queue depth starts creeping up during a “normal” window, you’ve got a bottleneck forming that is going to kill you the next time traffic spikes.
Can runtime monitoring detect security threats?
Absolutely. Most exploits leave a behavioral footprint. A function that suddenly starts making weird network calls or allocating massive, irregular blocks of memory is a huge red flag. By monitoring the runtime “baseline,” you can catch these anomalies way before a traditional perimeter defense even knows something’s wrong.


