
Omer Grinboim
Mar 03, 2026

By reducing MTTR, you not only restore services faster but also significantly improve customer satisfaction and brand loyalty. The faster you can resolve issues, the less impact they have on your business and your customers’ experience.
Picture a busy Friday evening with orders flowing in and revenue climbing as you watch. What happens if the checkout page suddenly stalls? Every minute it stays broken means lost sales, upset customers, and damage to your brand.
In that instant, the burning question is “How fast can we fix this?” The answer is captured in Mean Time to Resolution (MTTR), the time from the first alert to full recovery. But reducing MTTR in modern cloud systems is challenging because clues are scattered across dozens of logs, metrics, and dashboards. Digging through them by hand often sends teams down the wrong path first, and every detour lets more customers slip away.
This is where automated root cause analysis (RCA) changes the game. An RCA platform should anchor its analysis in production changes and code, narrowing the investigation to the specific production behavior that changed and the code responsible for it, rather than relying on clues. Instead of guessing, your team starts with a clear target, patches the issue quickly, and watches MTTR drop, along with stress levels and weekend call-outs.
In the rest of this article, you’ll see
With these ideas in hand, you’ll be ready to keep your applications running smoothly even on the busiest nights.
Root Cause Analysis is the practice of tracing an incident back through the chain of events and conditions that allowed it to occur, then removing or mitigating those conditions to prevent the failure from recurring.
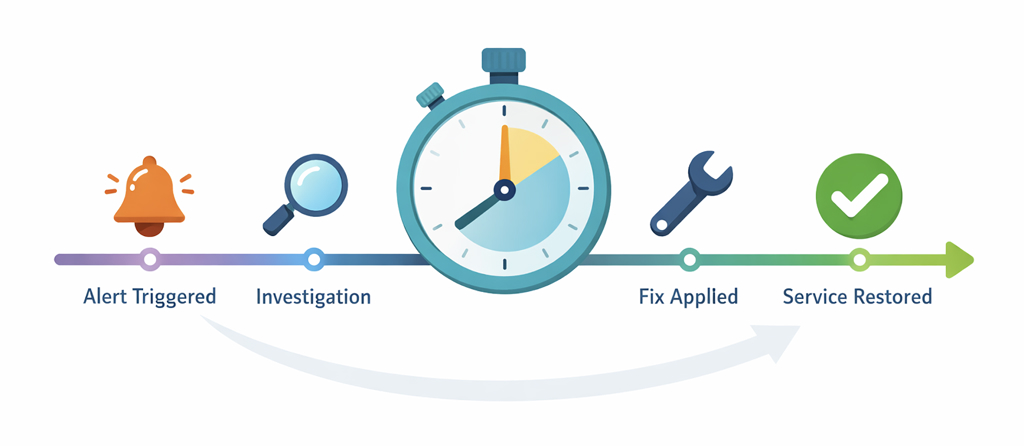
The diagram above illustrates the RCA process, which begins with identifying the alert, moves through investigation, and concludes with a fix applied and service restoration. Each step is crucial for narrowing down the root cause, ensuring swift resolution, and preventing future incidents.
Key points to keep in mind:
In a perfect world, RCA looks like this:
Although this seems simple, steps 2 and 3 can take forever in real-world systems.
The problem is that, in real systems, steps 2 and 3 can take forever because execution is distributed across threads, services, and queues. So a single logical call can expand into many asynchronous hops, with retries and buffering.
MTTR tells you how long it takes to restore a service to health. Think of it as a stopwatch. It starts the moment something breaks and stops when the service is healthy again. A short MTTR means you fixed the problem quickly.
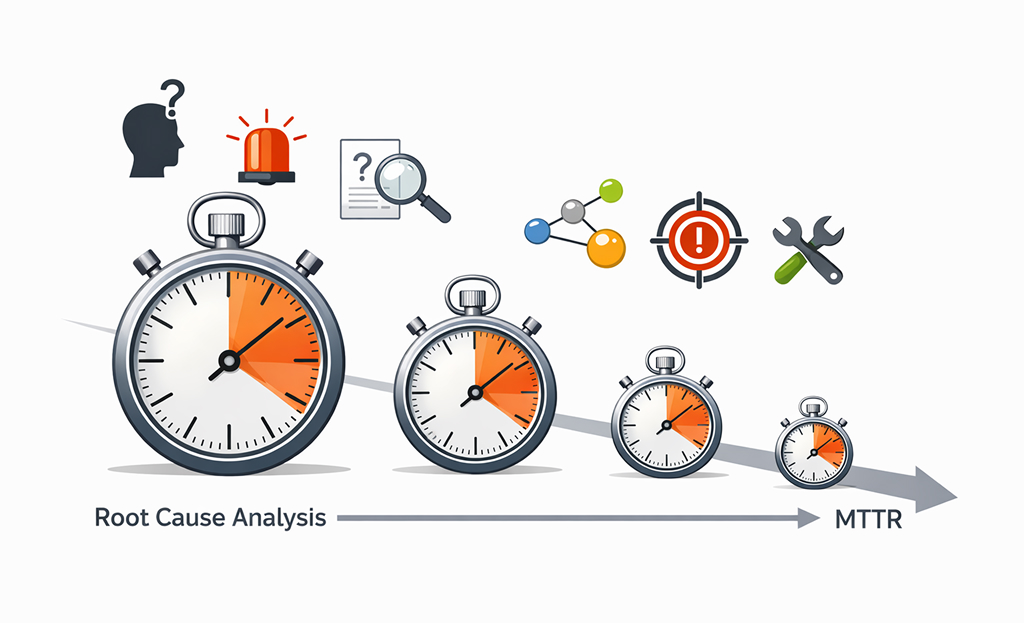
RCA shortens MTTR by reducing the time teams spend validating assumptions before they can act. This is the detective work you do to find out why the problem happened and how to keep it from happening again.
Why MTTR can drag on
When an outage hits, teams often lose precious minutes (or hours) in a few common ways:
How good is RCA shrinks MTTR?
A solid, quick RCA process helps you:
By removing those wasted steps, the stopwatch (MTTR) runs for a much shorter time, and the service is back up before users notice or at least before they get too frustrated.
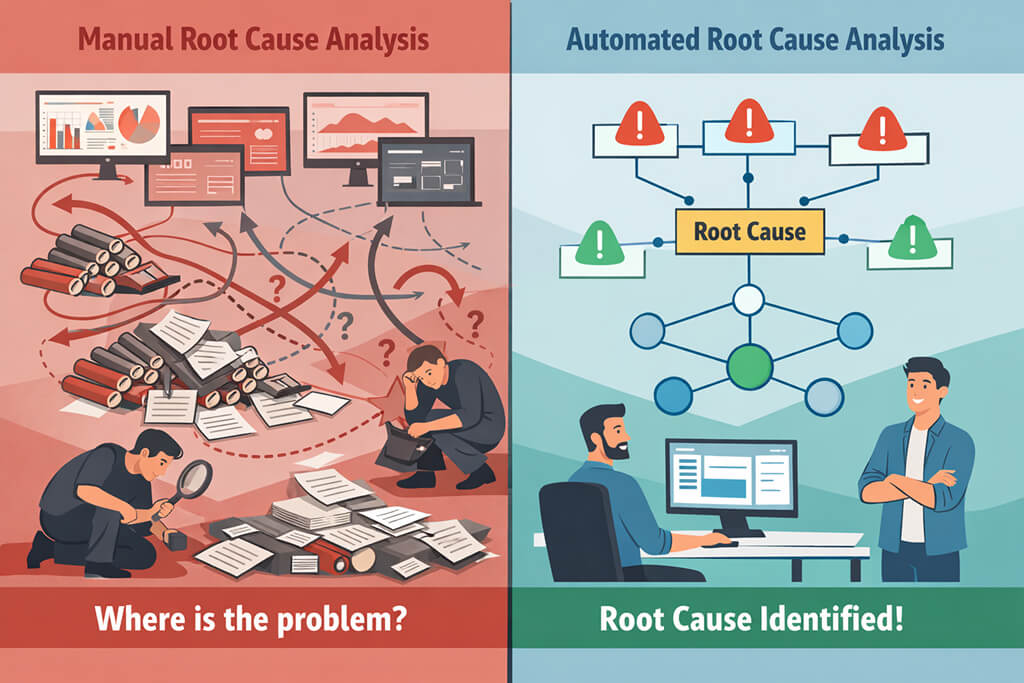
Manual RCA gets the job done for small, simple systems, but it can’t keep up with today’s complex, distributed apps. Automating RCA boosts speed, ensures consistent results, and turns every incident into valuable lessons. Ultimately, this is the key to lower MTTR.
1. Faster isolation of the likely cause
A quality root cause analysis platform correlates metrics, logs, traces, and change events, then highlights the single most likely starting point. Engineers spend time debugging, not searching, shaving minutes off the MTTR stopwatch.
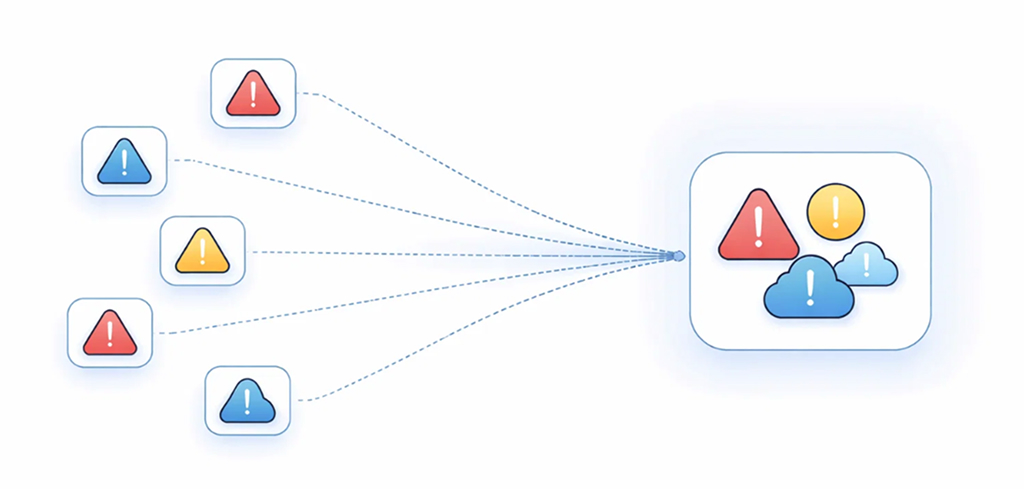
2. Less alert fatigue and less war-room chaos
Automated grouping combines 30 related pages into a single, coherent incident narrative. With noise removed, responders act sooner, and MTTR drops.
3. Better cross-team handoffs
Automated summaries and enriched context make it easier to answer:
So instead of digging through dozens of alerts, the next engineer gets a clear list of clues and can jump straight to fixing the problem.
4. Stronger post-incident learning
Because every outage is logged the same way: cause, proof, and fix, you can finally answer questions with real numbers:
With data like this, you improve your playbooks and keep cutting MTTR each time something goes wrong.
Not every monitoring product can slash MTTR. You need a root cause analysis platform built for the job. The best tools don’t just ring the pager; they pull together all your alerts, traces, changes, and ownership data, then point straight to the most likely cause.
Below are the core features that make that magic happen and turn “something’s wrong” into “here’s exactly where to look.”Correlation helps group symptoms, but RCA only becomes actionable when those symptoms are tied back to the production behavior that actually changed.
1. Event correlation (the “grouping” engine)
This is where the system decides which alerts belong together. Often they use correlations like:
2. Dependency and topology awareness
Topology is the difference between “CPU is high” and “CPU is high on the service that all checkout calls depend on.” Topology-aware RCA is widely discussed in AIOps contexts because causality often follows dependency chains.
3. Change intelligence
Many real incidents start with a change, such as deployments, config updates, feature flags, infrastructure updates, or policy changes.
Modern tools ingest change events and connect them to incident windows so responders can ask, fast: “What changed right before this started?”
4. Observability integration (metrics, logs, traces)
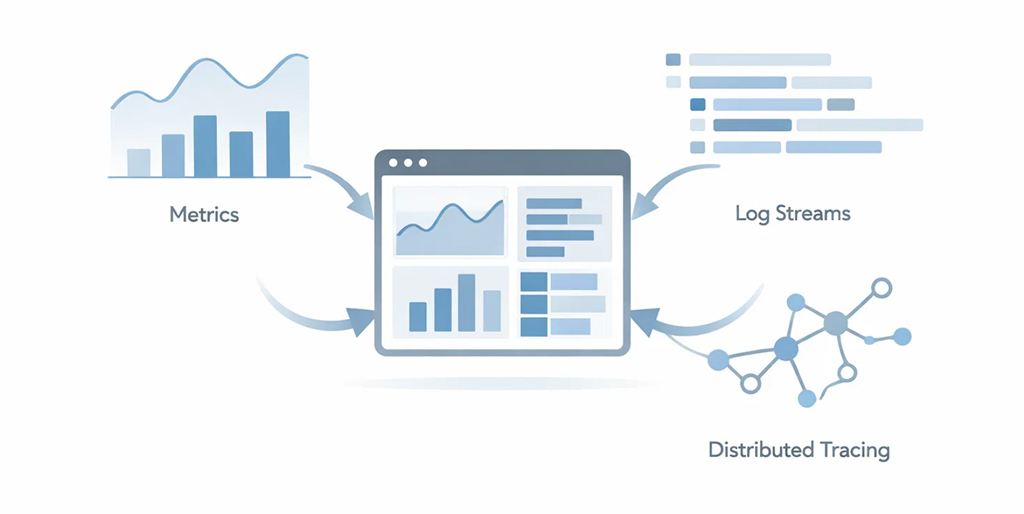
While tracing provides critical context about how requests travel through your system and where delays might occur, it is important to remember that it supports the RCA process by confirming impact and helping identify where to investigate further, not by pinpointing the root cause directly.
Distributed tracing is especially valuable because it shows request flow across services and provides timing breakdowns. OpenTelemetry-based tracing has become a common way to standardize that signal across environments. These signals provide supporting evidence and confirmation of impact, not the source of the root cause itself.
In practical RCA terms, traces help you answer:
5. Enrichment and ownership context
The best systems don’t just say “service A is suspicious.” They attach:
That’s what turns an alert into a response plan.
6. Suggested actions (with guardrails)
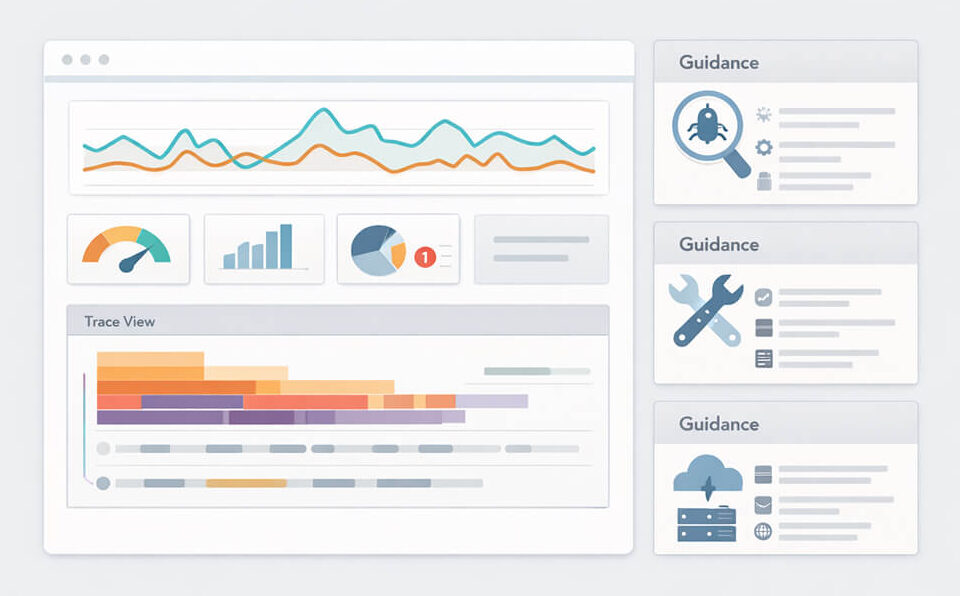
Some platforms provide suggested remediation steps and plain-language incident summaries built from enriched incident data. This is useful when it’s handled carefully. Suggestions should be:
At this point, you’re not just buying root cause analysis software. You’re building a workflow that lets responders move from detection to confident action without losing time to confusion.
Automation is powerful, but it’s not a silver bullet. Below are the most common pitfalls of treating automations as a checkbox, along with simple ways to avoid them.
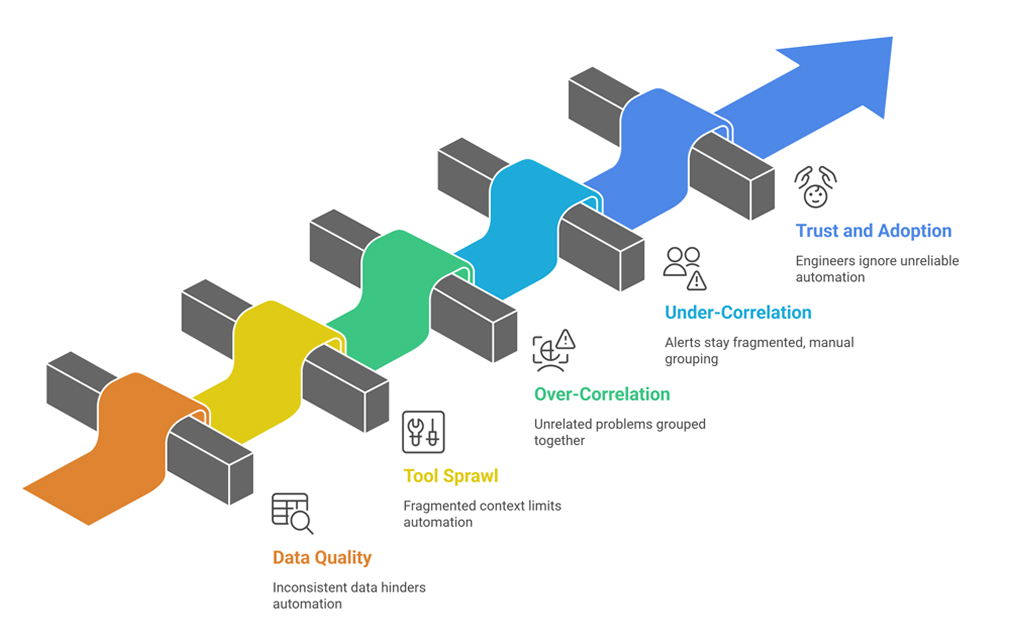 1. Garbage in, garbage out (data quality)
Automation depends on consistent signals. Common issues:
Fix: Standardize metadata, enforce it in CI/CD, and adopt consistent instrumentation (ideally with a shared library).
2. Tool sprawl and fragmented context
If monitoring, incident management, deploy tracking, and ownership live in separate systems with weak integration, automation can’t connect the dots.
Fix: Start by integrating the most valuable sources first:
3. Over-correlation (the “everything is one incident” problem)
Overly aggressive correlation can group unrelated problems, creating confusion.
Fix: Tune correlation rules over time and validate with post-incident reviews. The system should be explainable: “Grouped because X and Y shared a service tag and occurred within N minutes.”
4. Under-correlation (the “100 pages for one outage” problem)
The opposite issue is that pages and alerts stay fragmented, and responders still do manual grouping.
Fix: Identify the alerts that commonly co-occur and use them as correlation anchors. Let the tool learn patterns, but don’t be afraid to start with clear rule-based logic.
5. Trust and adoption
Engineers will ignore automation if it’s wrong too often or if it can’t explain itself.
Fix: Roll out incrementally. Prove value on one workflow first (checkout latency, login failures, API error spikes). Share incident write-ups where the tool genuinely saved time.
Here are the simple steps you need to follow to make automated root cause analysis work in your project.
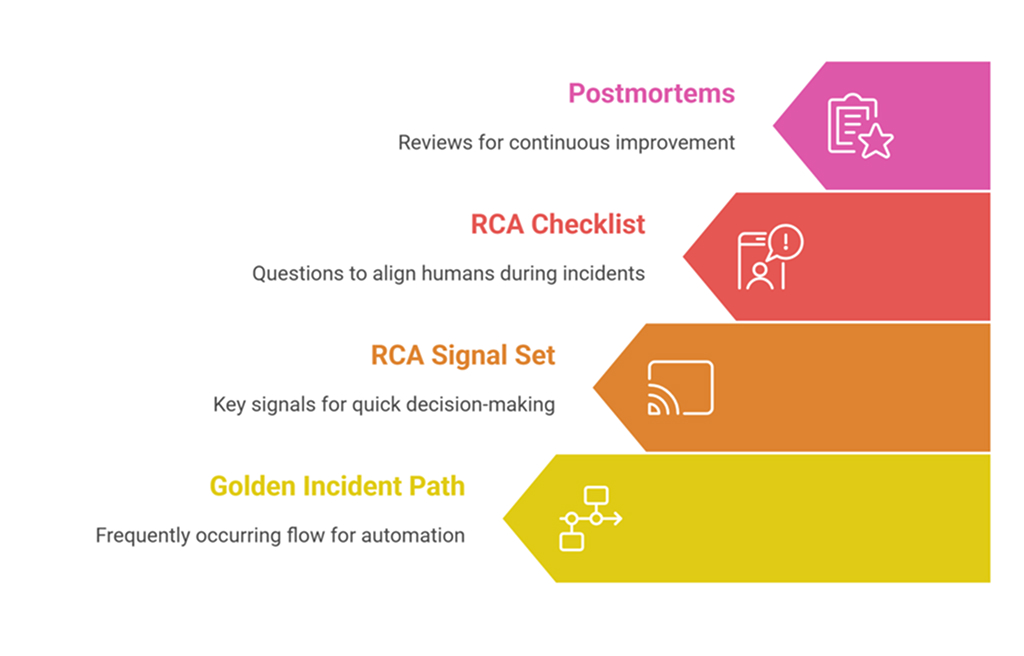
Start with one “golden” incident path
Pick a flow that matters and happens often:
Instrument it deeply and make it your first automation target.
Build a minimum RCA signal set
You don’t need everything on day one. You need the signals that help you decide quickly:
Use a lightweight RCA checklist during incidents
This keeps humans aligned while the automation helps with evidence:
Keep the loop closed with postmortems
After each incident, ask:
That’s how you turn automation into continuous improvement, not just another dashboard.
Lower MTTR is less about moving faster and more about wasting less time. Teams lose minutes when they face too many alerts, chase the wrong leads, or wait for the right person to jump in. Automated root cause analysis pulls all the signals together, adds helpful context, and points everyone to the most likely cause with clear proof.
The best way to begin is simple. Start with one critical service path, connect your key signals, and review what worked after each incident. Over time, you get fewer long war rooms, cleaner handoffs, and faster recovery.
1. How do organizations measure the ROI of automated RCA tools?
Track MTTR, mean time to identify (MTTI), escalations per incident, and on-call hours. Pair them with business metrics, such as downtime costs, support tickets, and lost conversions, for a clear before-and-after view.
2. What are good indicators that an RCA solution is effective?
Earlier cause detection, fewer war-room participants, faster handoffs, cleaner timelines, and richer postmortems. A bonus metric: total alert volume per incident should drop.
3. Is automated root cause analysis only valuable for large organizations?
No. Smaller teams may benefit even more because they have fewer specialists to spare. Start with one critical workflow, prove the value, and expand as trust and instrumentation grow.

